10 AI Tools Transforming Data Science for Market Research Analysts

10 AI Tools Transforming Data Science for Market Research Analysts
Overview
The article explores the transformative role of AI tools in enhancing data science capabilities, particularly for market research analysts. It emphasizes how tools such as Microsoft Power BI, Tableau, and Google Analytics utilize AI and advanced analytics. These tools streamline data access, improve decision-making, and foster actionable insights. As a result, they significantly elevate the effectiveness and efficiency of market research processes.
How can these advancements in AI tools impact your work in market research? By leveraging these technologies, analysts can gain a competitive edge, ensuring that their insights are not only timely but also deeply informed by data-driven strategies.
Introduction
As the landscape of market research evolves, the integration of artificial intelligence tools is fundamentally reshaping how analysts access and interpret data. These innovative technologies streamline the process of gathering high-quality datasets, empowering professionals to derive actionable insights more efficiently.
However, with numerous options available, how can market research analysts discern which AI tools will truly enhance their capabilities and drive impactful decision-making? This exploration delves into ten transformative AI tools that are revolutionizing data science for market research analysts, offering a glimpse into the future of informed strategy and analysis.
Initial Data Offering: Streamline Access to Quality Datasets
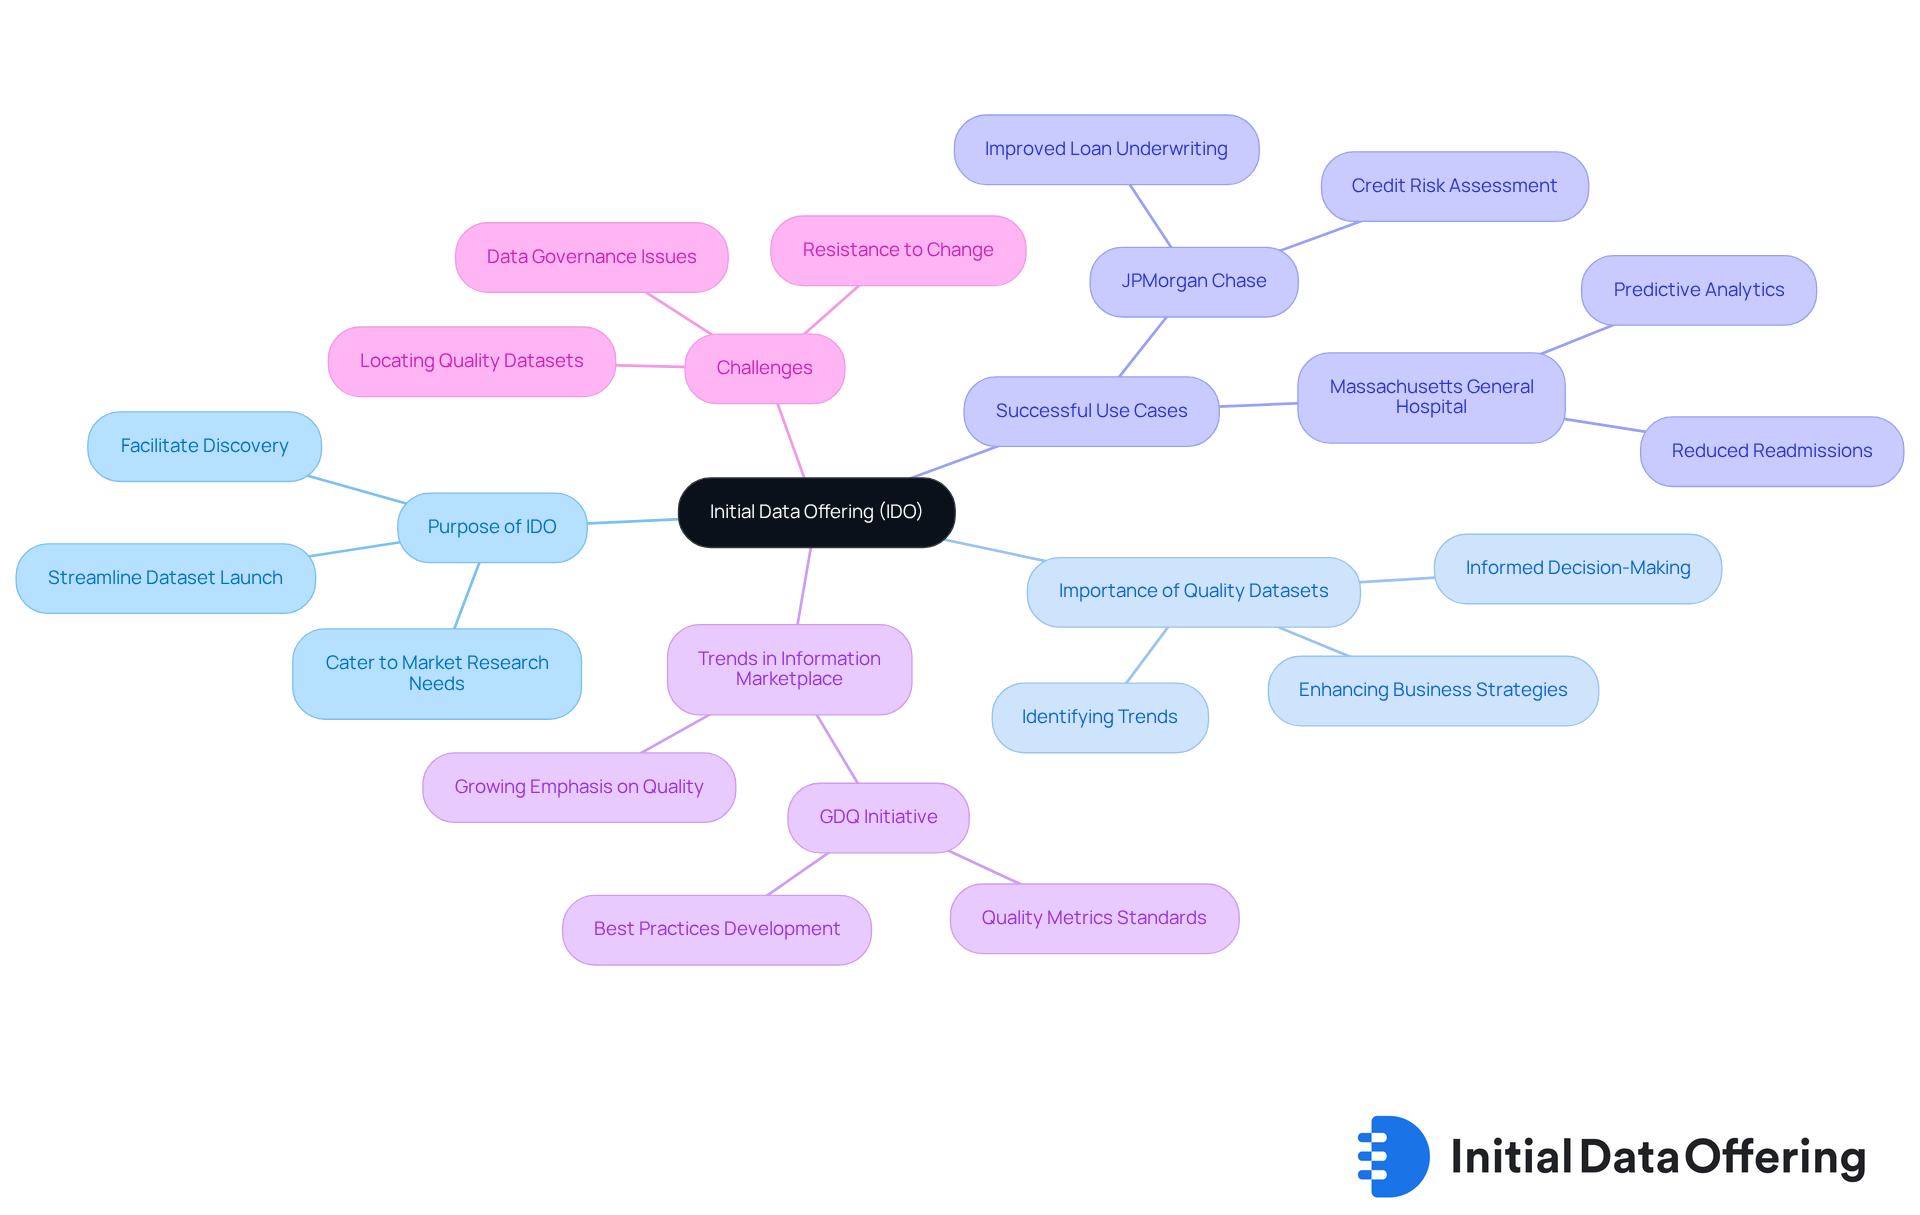
The Initial Data Offering (IDO) serves as a crucial platform that streamlines the launch and discovery of new datasets, specifically catering to the needs of market research professionals. By curating high-quality datasets across various domains such as finance, social media, and environmental studies, IDO enables analysts to swiftly access valuable resources essential for informed decision-making. This streamlined access is particularly vital as the continues to expand, driven by the increasing demand for secure and scalable platforms.
The impact of quality datasets on decision-making in market research is profound. Analysts utilizing high-quality information can identify emerging trends and shifts in consumer preferences, allowing businesses to adjust their strategies effectively. For instance, JPMorgan Chase employed extensive analytics to enhance its credit risk evaluation capabilities, resulting in improved loan underwriting precision and reduced default rates. Such successful implementations underscore the significance of reliable information in driving strategic outcomes.
As we approach 2025, the latest trends in the information marketplace reveal a growing emphasis on quality and governance. The Global Data Quality (GDQ) initiative aims to establish standards for quality metrics, ensuring that researchers can depend on the datasets they utilize. Additionally, specialists in the field highlight the ongoing challenges of locating quality datasets, emphasizing that high-quality information serves as the foundation for meaningful analysis and informed decision-making. By fostering a collaborative environment and promoting superior information, IDO empowers professionals to leverage the full potential of data in their investigative efforts.
Microsoft Power BI: Transform Data into Actionable Insights
Microsoft Power BI is a powerful business analytics tool that enables market research analysts to convert data into actionable insights. Its intuitive interface allows users to create interactive reports and dashboards that effectively showcase key trends and metrics. This capability accelerates decision-making and enhances communication with stakeholders, ensuring findings are presented clearly and persuasively. As Robert Tischler observes, "Power BI is an entry portal for analyzing, distributing and, above all, visualizing business information," which highlights its foundational role in analysis.
The impact of information visualization on organizational decision-making is significant. By utilizing Power BI's advanced features, professionals can leverage real-time information tracking and predictive analytics to inform strategic choices. For example, the integration of Microsoft Fabric facilitates seamless data connectivity, enabling researchers to generate insights quickly and efficiently. Moreover, with nearly 30 percent of companies currently opting for Power BI, its widespread adoption underscores its effectiveness in the market.
Business analysts have recognized Power BI's effectiveness in streamlining workflows. The platform's AI-driven functionalities, including the new Copilot feature, allow users to engage with information using natural language, making complex analyses accessible even to non-technical team members. This democratization of information empowers organizations to make based on comprehensive insights. As Rüdiger Spies emphasizes, the selection of appropriate tools should lead to enhanced utilization of enterprise information to maintain a competitive advantage.
As we look ahead to 2025, Power BI continues to evolve, unveiling features tailored for market research professionals. Enhanced role-based access control ensures that confidential information is protected while allowing relevant stakeholders to access necessary insights. Furthermore, the mobile app's features now include more intelligent dashboards, improved layout options, and push notifications, enabling users to access dashboards on the go, ensuring essential information is always within reach.
Real-world examples demonstrate Power BI's effectiveness in enhancing decision-making. Organizations utilizing Power BI have reported increased agility in responding to changes in their environment, thanks to its real-time information capabilities. By harnessing the power of visual representation, professionals can drive innovation and strategic planning, ultimately leading to improved outcomes across various sectors.
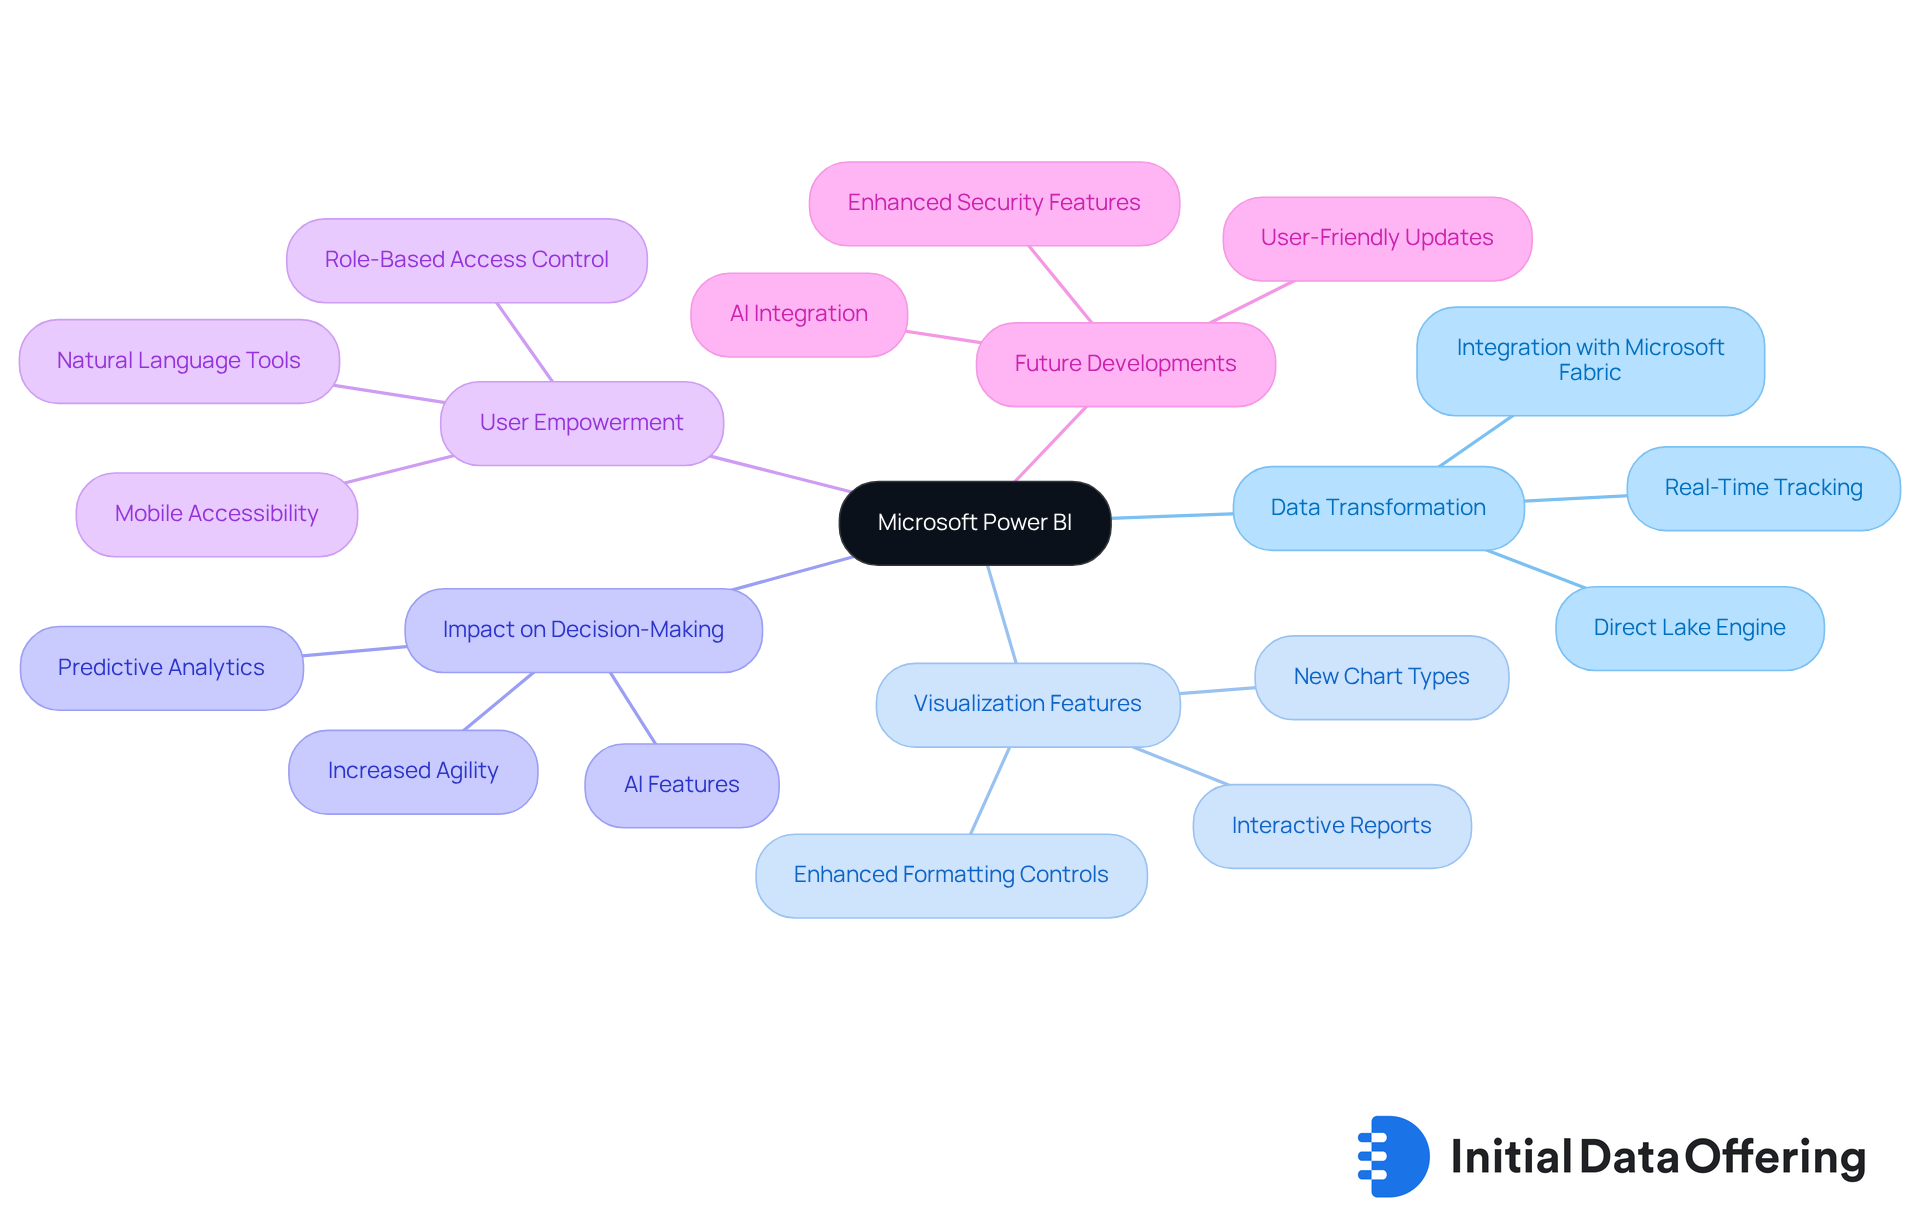
Tableau: Visualize Complex Data for Better Insights
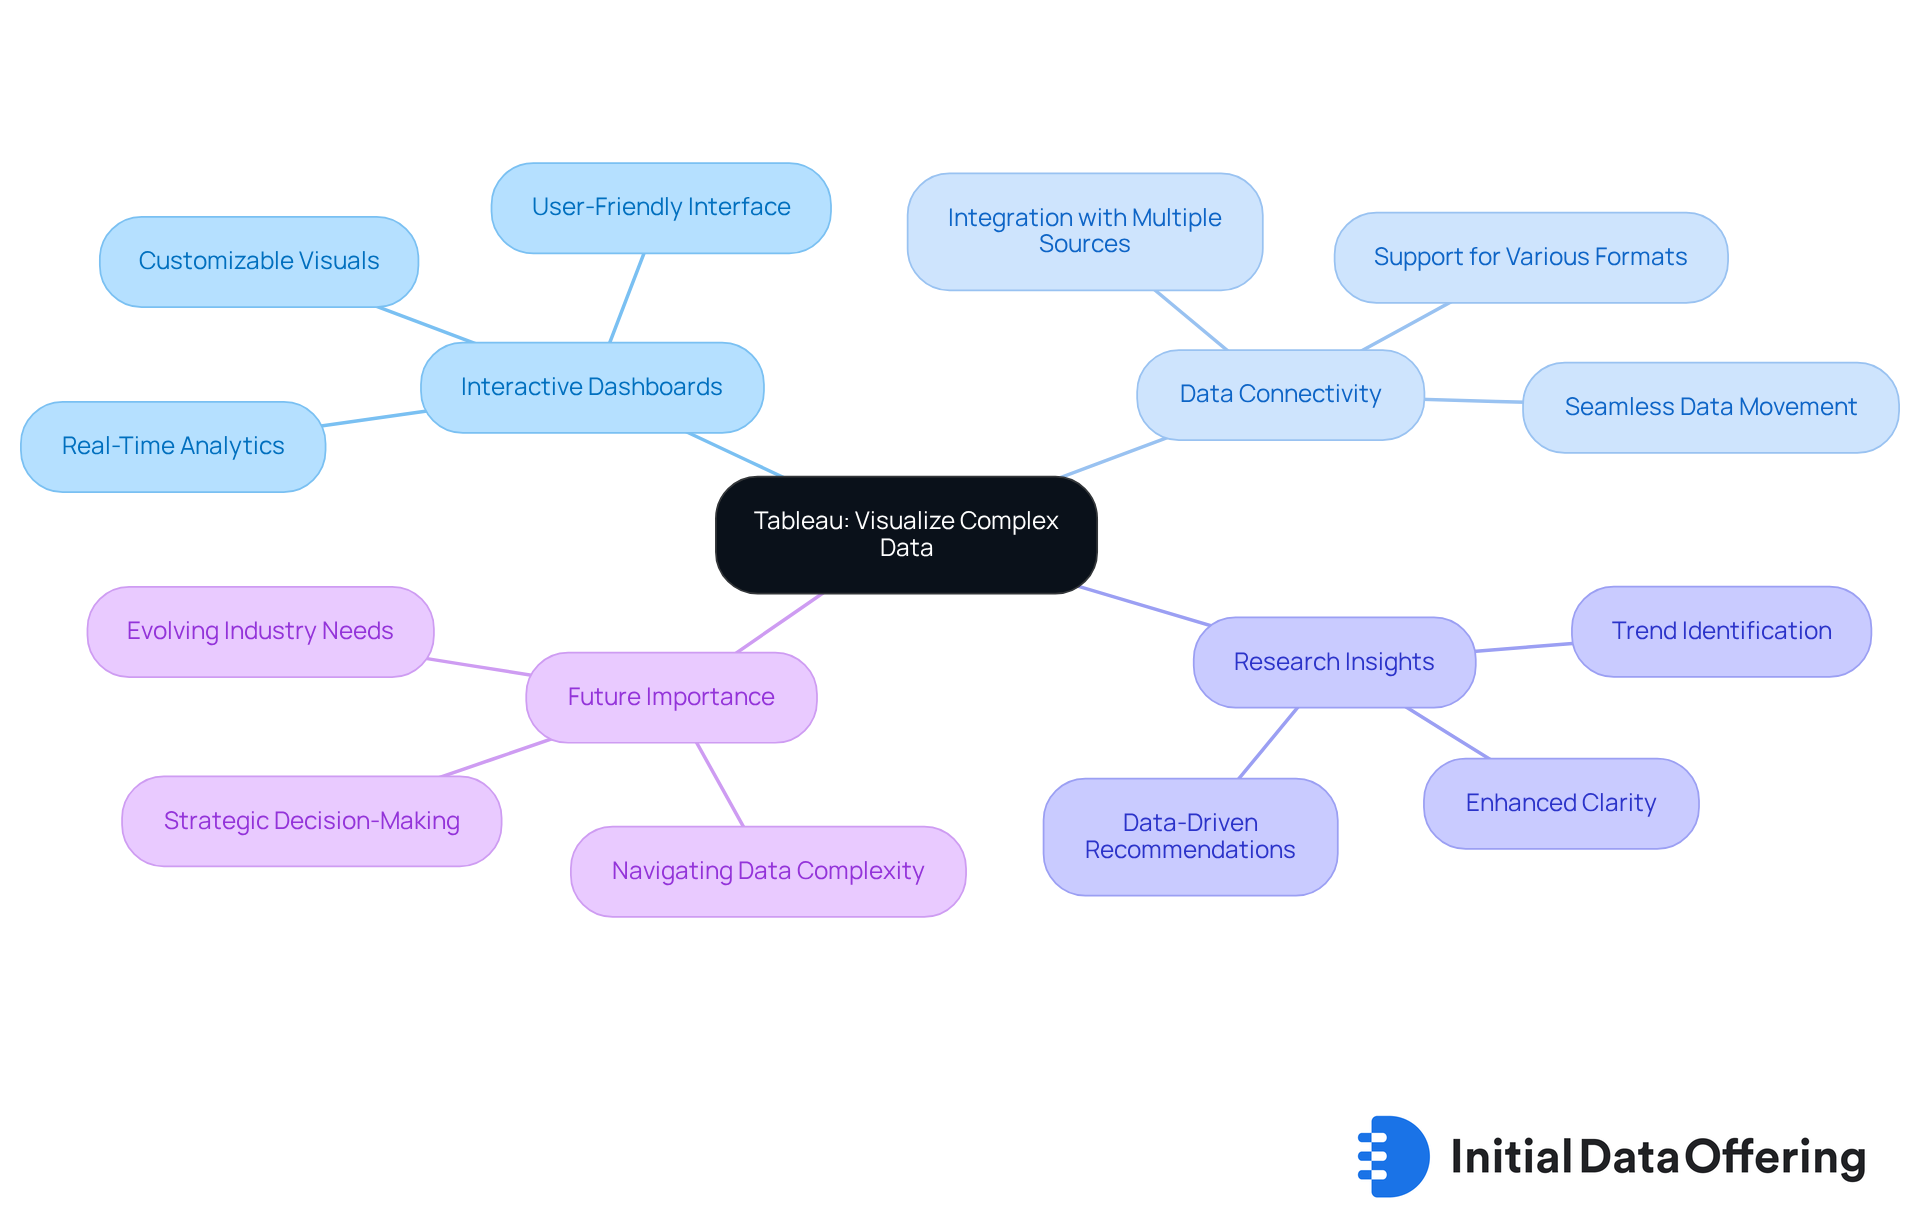
Tableau serves as a premier , empowering market evaluation professionals to design interactive and shareable dashboards. Its robust connectivity to diverse information sources enables specialists to present complex datasets in a clear and comprehensible manner, establishing it as an indispensable asset in their toolkit. By leveraging Tableau, researchers can uncover trends and insights that might elude traditional analysis methods, significantly enhancing their research outcomes.
Industry experts emphasize that the platform's ability to clarify intricate information fosters a deeper understanding of trends and consumer behaviors, thereby facilitating informed decision-making. For instance, professionals who utilize Tableau have reported increased clarity in their findings, which allows for more strategic recommendations grounded in data-driven insights.
As we look toward the evolving landscape of 2025, the effectiveness of data visualization tools like Tableau will be crucial for professionals aiming to navigate and interpret the escalating complexity of data in industry analysis.
Google Analytics: Understand Consumer Behavior with AI Insights
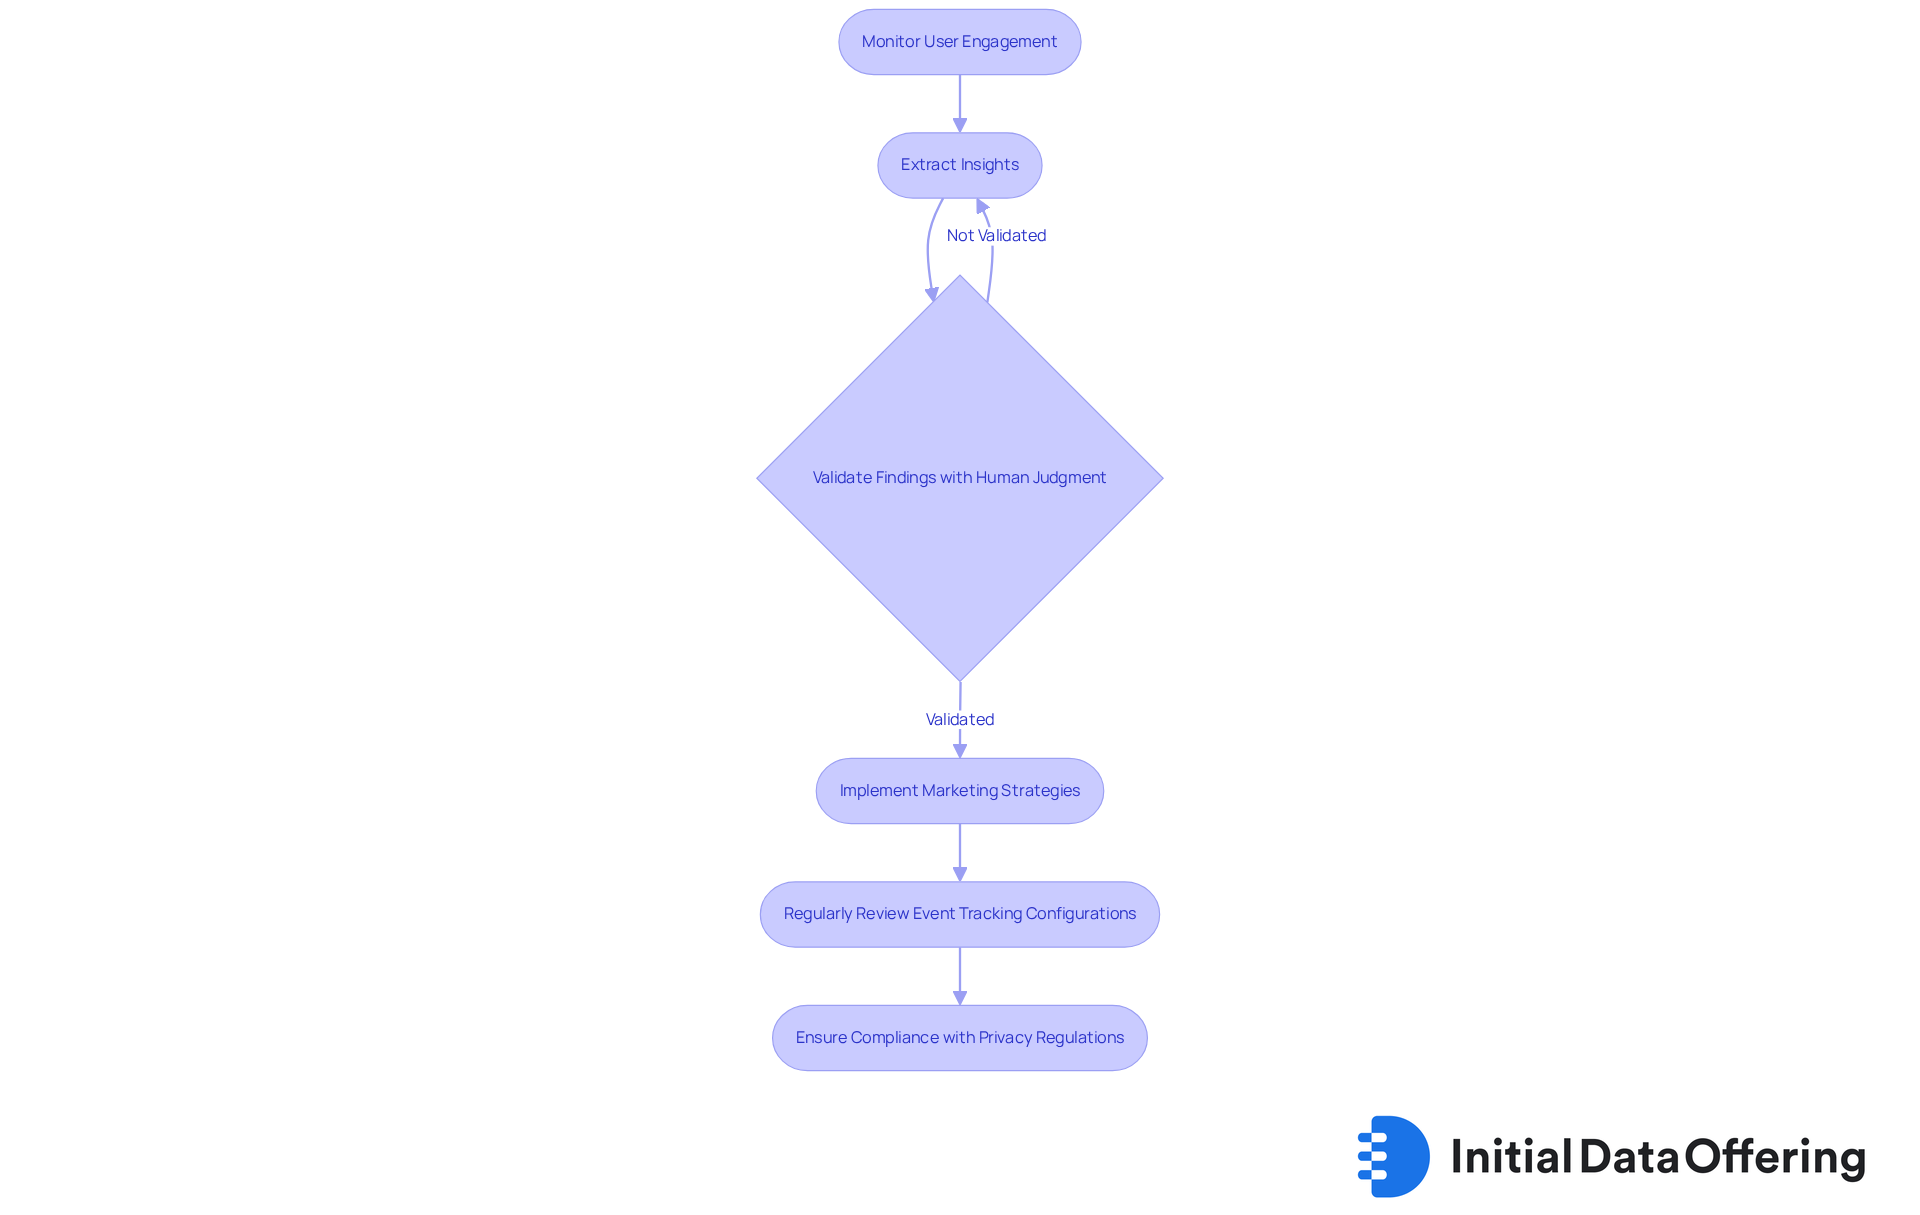
Google Analytics serves as an essential tool for market researchers aiming to decode consumer behavior through data-driven insights. By meticulously monitoring user engagements across websites and applications, professionals can extract vital information regarding customer preferences and emerging trends. The insights generated by Google Analytics through artificial intelligence with data science empower experts to refine marketing strategies and enhance product development initiatives. For example, predictive metrics in GA4 can forecast customer lifetime value and identify users most likely to convert, provided that the property meets the requirement of having at least 1,000 positive and 1,000 negative samples. This capability facilitates targeted marketing efforts that significantly boost engagement and conversion rates.
Moreover, the integration of artificial intelligence with data science can enhance conversion rates by over 60% by determining the optimal times for in-app prompts using over 200 mobile signals, showcasing its effectiveness in marketing strategies. The integration of artificial intelligence with data science and Google Analytics allows for real-time assessment of user behavior, enabling professionals to dynamically modify campaigns based on current consumer actions. However, while AI offers powerful insights, it is crucial for professionals to validate these findings with human judgment to ensure accuracy and relevance. This balanced approach not only enhances the effectiveness of marketing strategies but also fosters a deeper understanding of consumer behavior in an increasingly data-driven landscape.
To effectively from Google Analytics, professionals should regularly review their event tracking configurations and ensure adherence to privacy regulations such as GDPR and CCPA. How might these insights transform your marketing approach? Regular evaluations can lead to more informed decisions and improved outcomes.
IBM Watson Analytics: Empower Data-Driven Decision Making
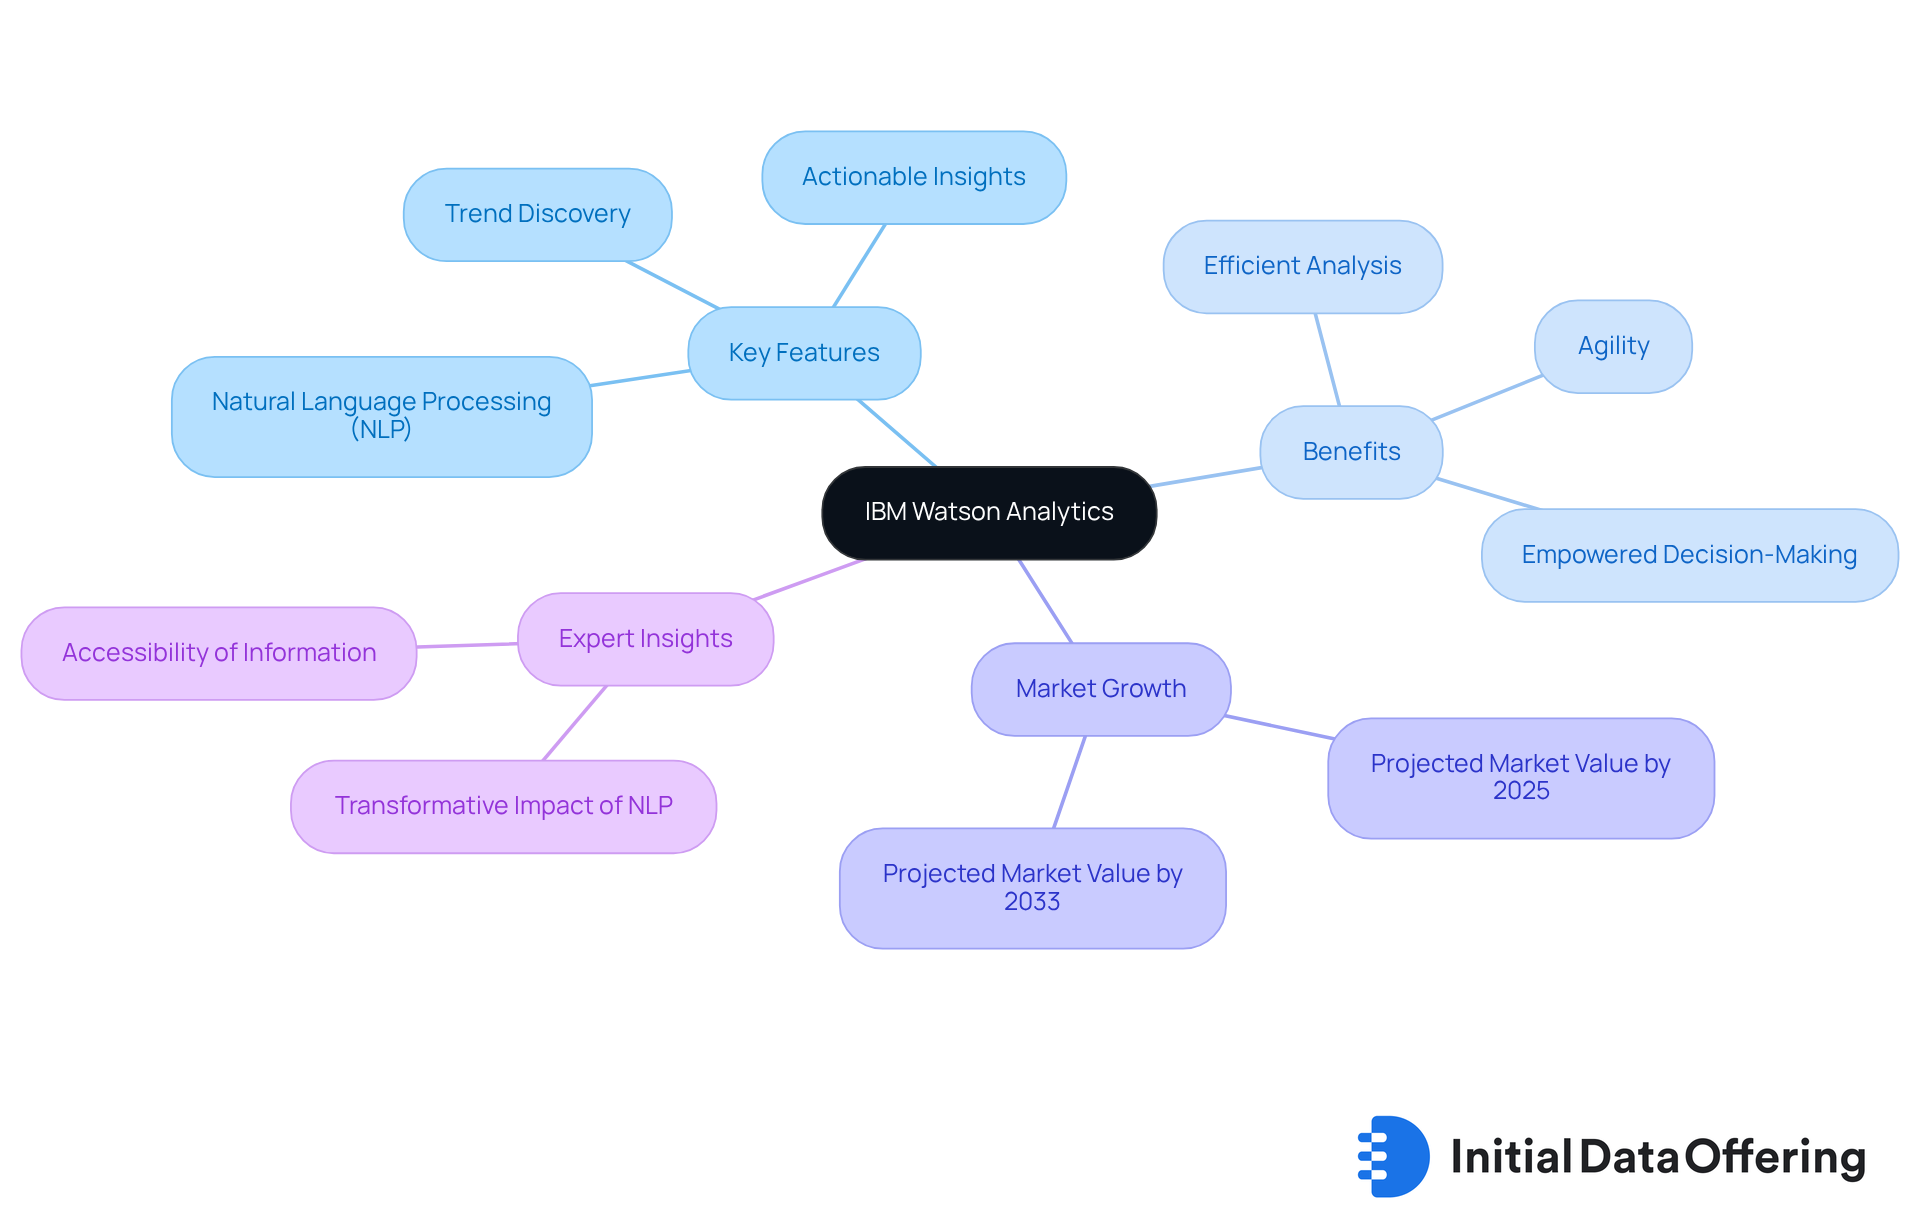
IBM Watson Analytics stands out as an analytics platform that utilizes artificial intelligence with data science to significantly enhance the decision-making capabilities of market research professionals. By utilizing advanced natural language processing (NLP), users can ask questions about their datasets and receive immediate, actionable insights. This functionality streamlines the analysis process, enabling analysts to concentrate on interpreting results rather than being encumbered by preparation tasks.
The efficiency of data analysis is greatly enhanced through NLP, facilitating intuitive interactions with data. Analysts can quickly uncover trends and patterns, allowing for a more agile response to economic shifts. As the demand for analytics tools powered by artificial intelligence with data science continues to rise, projections suggest that the market for such solutions will experience substantial growth by 2025, driven by the need for swift insights in an increasingly data-centric environment.
Insights from analytics experts highlight the transformative impact of NLP in analysis, emphasizing its role in enhancing interpretation and decision-making processes. For instance, a leading data expert noted, "NLP has transformed the way we engage with information, making it more accessible and practical for professionals." With IBM Watson Analytics, data professionals are empowered to , fostering informed strategies and driving innovation across various sectors. Furthermore, the IBM Watson services sector is projected to reach $76.47 billion by 2033, highlighting the growing significance of artificial intelligence with data science in industry analysis.
SAS Analytics: Forecast Trends with Predictive Analytics
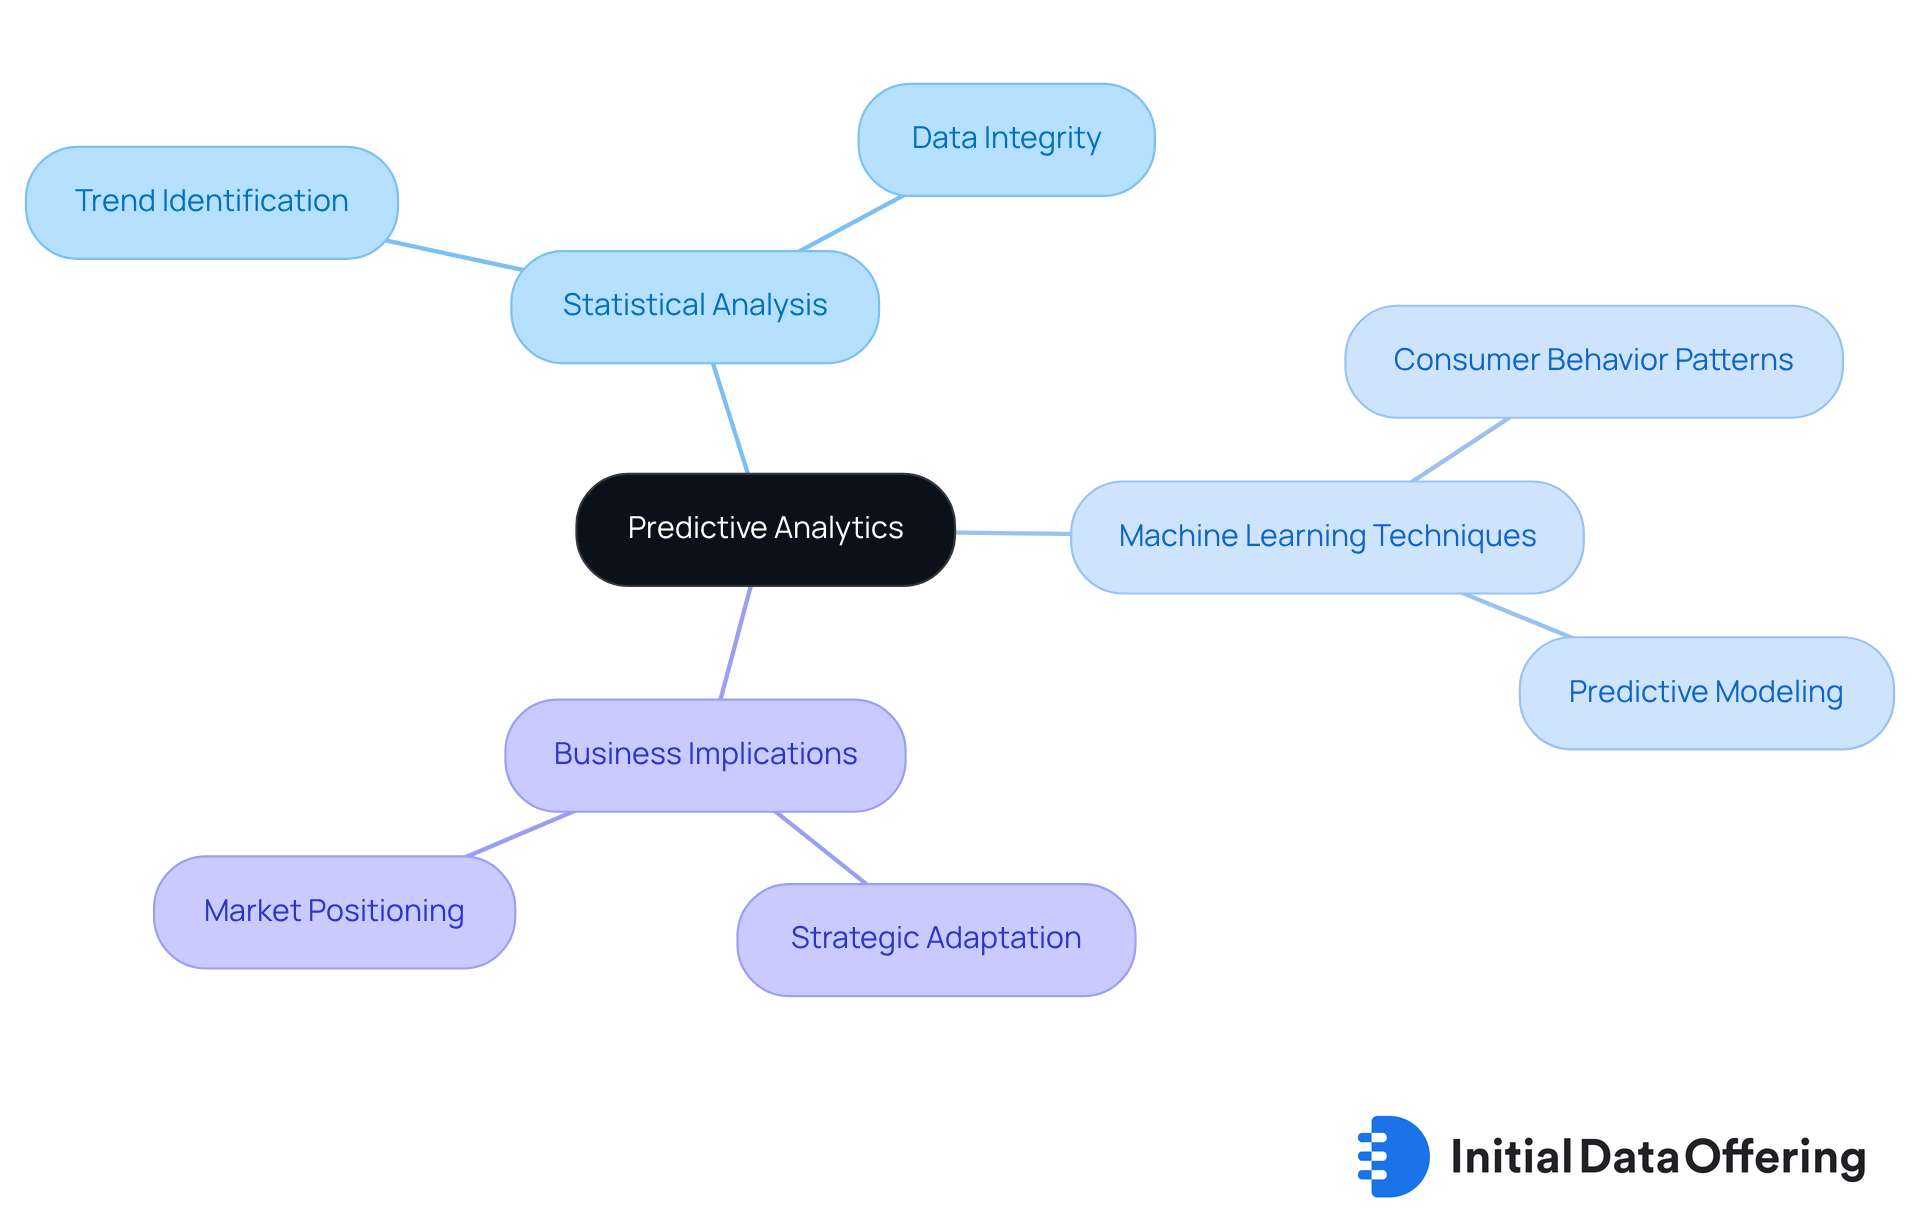
SAS Analytics offers sophisticated predictive analytics tools that empower professionals to anticipate trends and consumer behaviors. These tools utilize statistical analysis and machine learning techniques, enabling experts to identify potential shifts in trends and preferences. This capability is crucial for businesses aiming to .
How can your organization leverage these insights to stay ahead of the competition? By understanding the patterns in consumer behavior, companies can make informed decisions that enhance their market positioning and drive success.
Qlik Sense: Explore Data Relationships for Hidden Insights
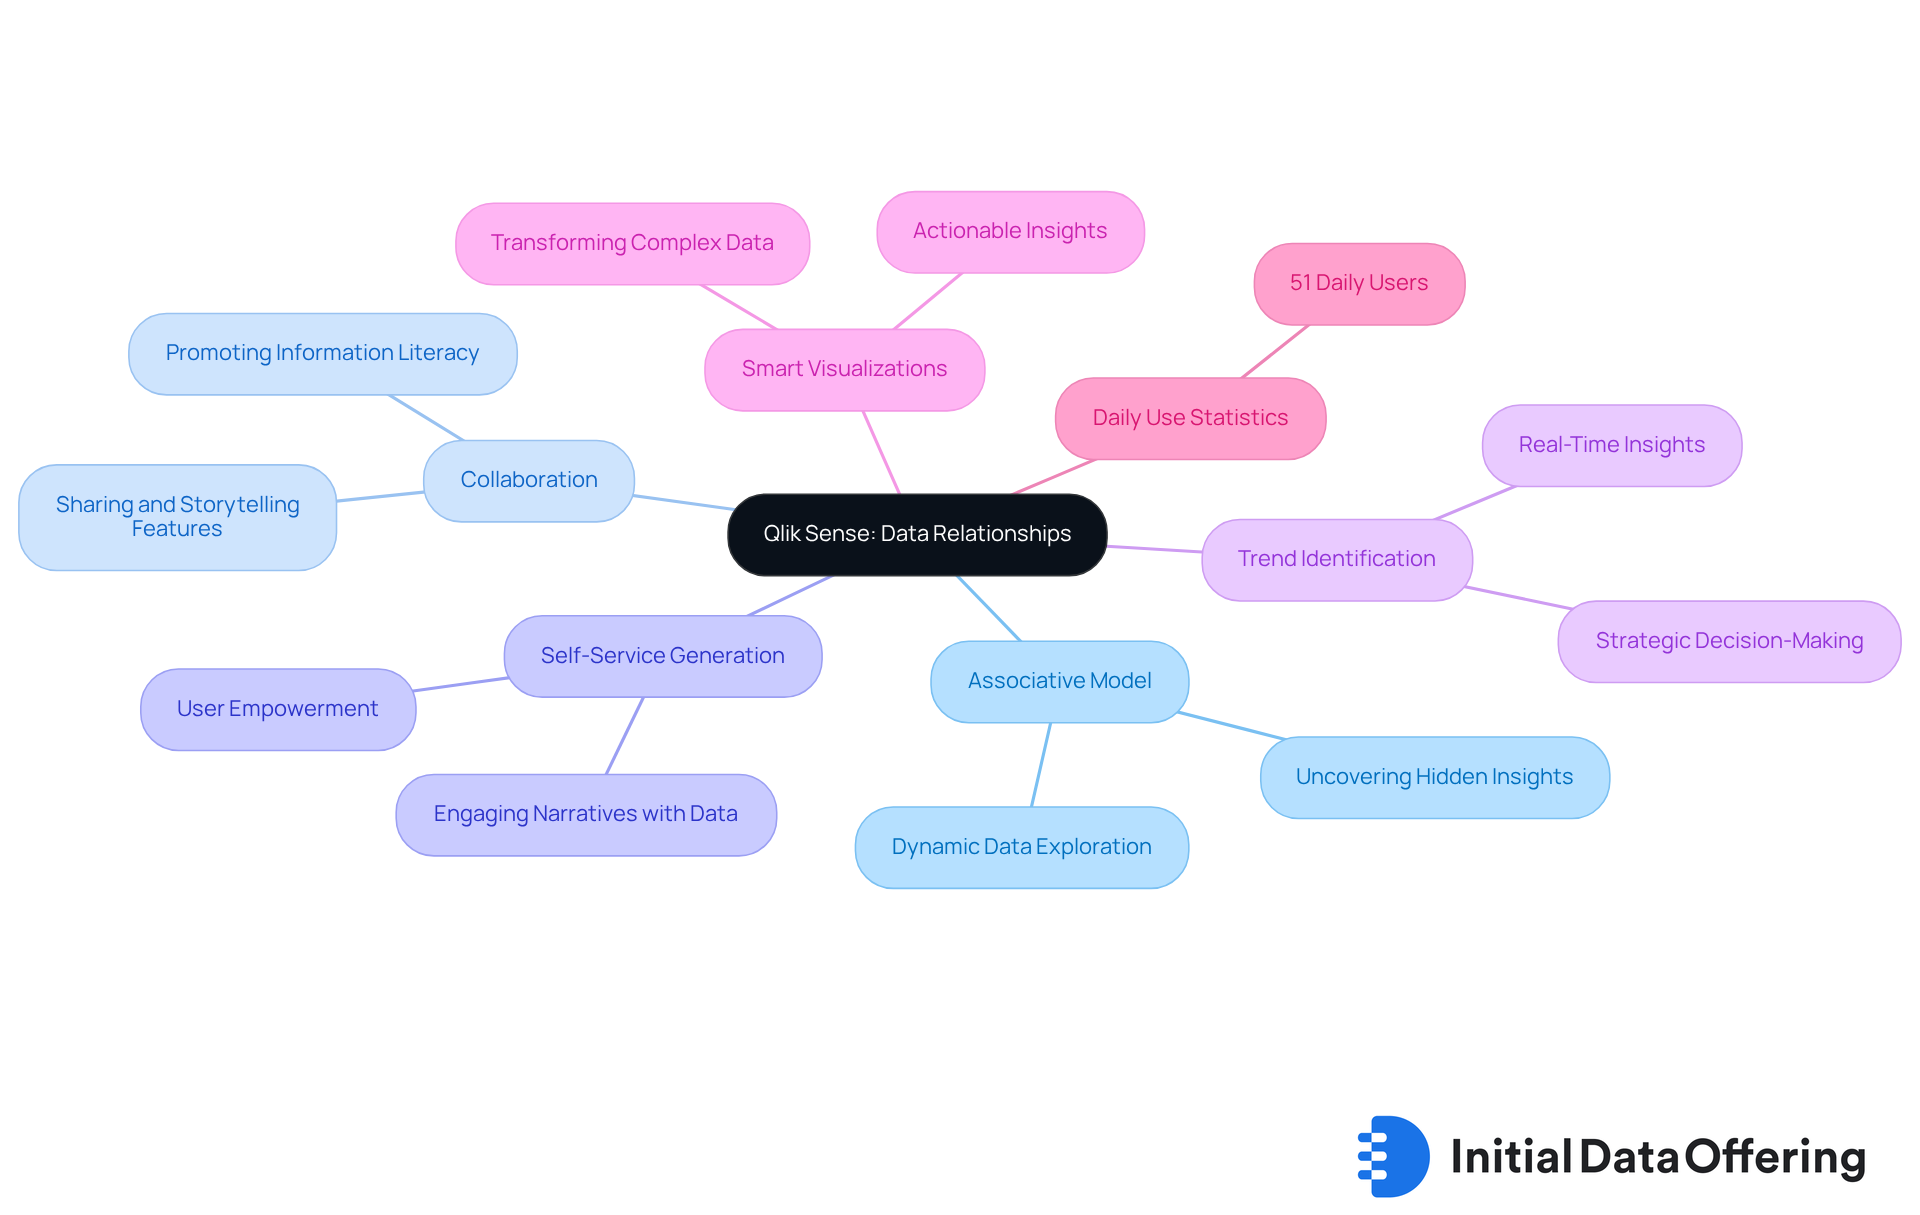
Qlik Sense stands out as a powerful analytics platform that empowers market research analysts to explore relationships and uncover hidden insights. Its innovative associative model allows users to navigate information intuitively, revealing connections that traditional analysis methods often miss. This dynamic exploration capability not only enhances the analytical process but also promotes more informed decision-making.
As Richard Harris, a Senior Full Stack Developer and Technology Educator, notes, 'Qlik Sense encourages collaboration and information literacy within organizations through its sharing and storytelling features.' This emphasis on enables professionals to craft engaging narratives with their data, amplifying the overall impact of their findings.
For instance, organizations utilizing Qlik Sense have reported substantial improvements in their ability to identify trends and make strategic decisions based on real-time insights. Remarkably, 51% of respondents utilize Qlik on a daily basis, highlighting its effectiveness and popularity among users.
Moreover, Qlik Sense offers smart visualizations that go beyond basic charts and graphs, allowing data professionals to transform complex datasets into actionable insights, thereby fostering innovation and a competitive advantage in their respective fields.
RapidMiner: Simplify Predictive Modeling for Market Research
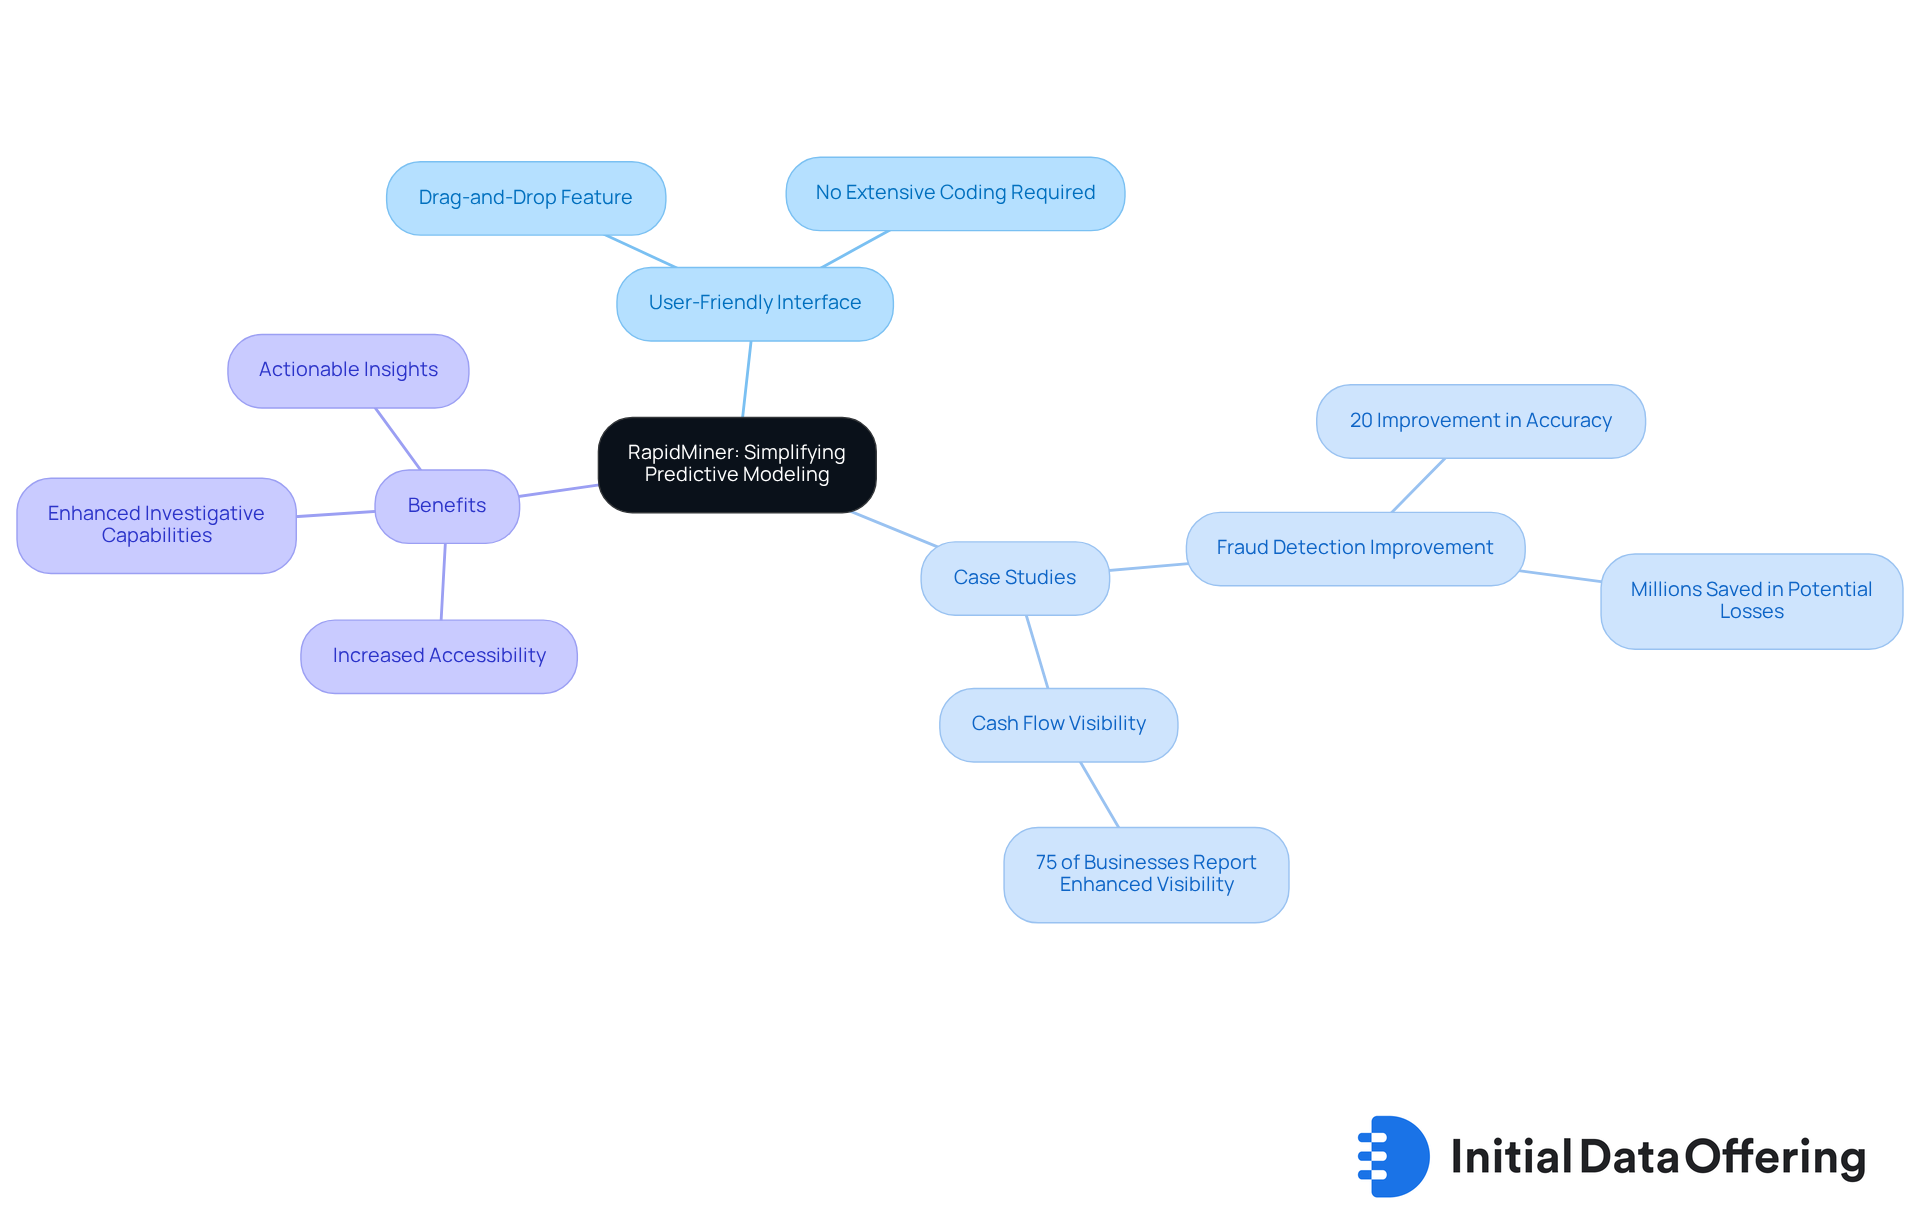
RapidMiner serves as a pivotal data science platform that simplifies predictive modeling for market professionals. Its intuitive drag-and-drop interface allows users to build predictive models without the need for extensive coding expertise. This not only increases accessibility but also enables professionals to concentrate on extracting valuable insights rather than grappling with complex technicalities. As a result, RapidMiner significantly enhances investigative capabilities, empowering professionals to effectively derive actionable insights.
For example, a financial services company leveraged RapidMiner to create a fraud detection model, resulting in a 20% improvement in accuracy and saving millions in potential losses. Furthermore, predictive analytics tools like RapidMiner have been demonstrated to improve decision-making processes; 75% of businesses that adopted predictive cash forecasting reported enhanced visibility into cash flow.
These instances underscore the platform's effectiveness in transforming data into strategic advantages, establishing it as an essential resource for industry analysts in 2025.
Alteryx: Combine Data Preparation and Analytics for Efficiency
Alteryx distinguishes itself as a robust platform that effortlessly combines information preparation with analytics, enabling research professionals to enhance their workflows. The recent launch of Alteryx One—a unified platform designed to enhance analytics capabilities—offers users a more streamlined experience. By automating vital tasks such as information cleansing and preparation, specialists can devote more time to examining data and extracting actionable insights. This shift towards automation is crucial in today's rapidly evolving business environment, where efficiency significantly influences decision-making processes.
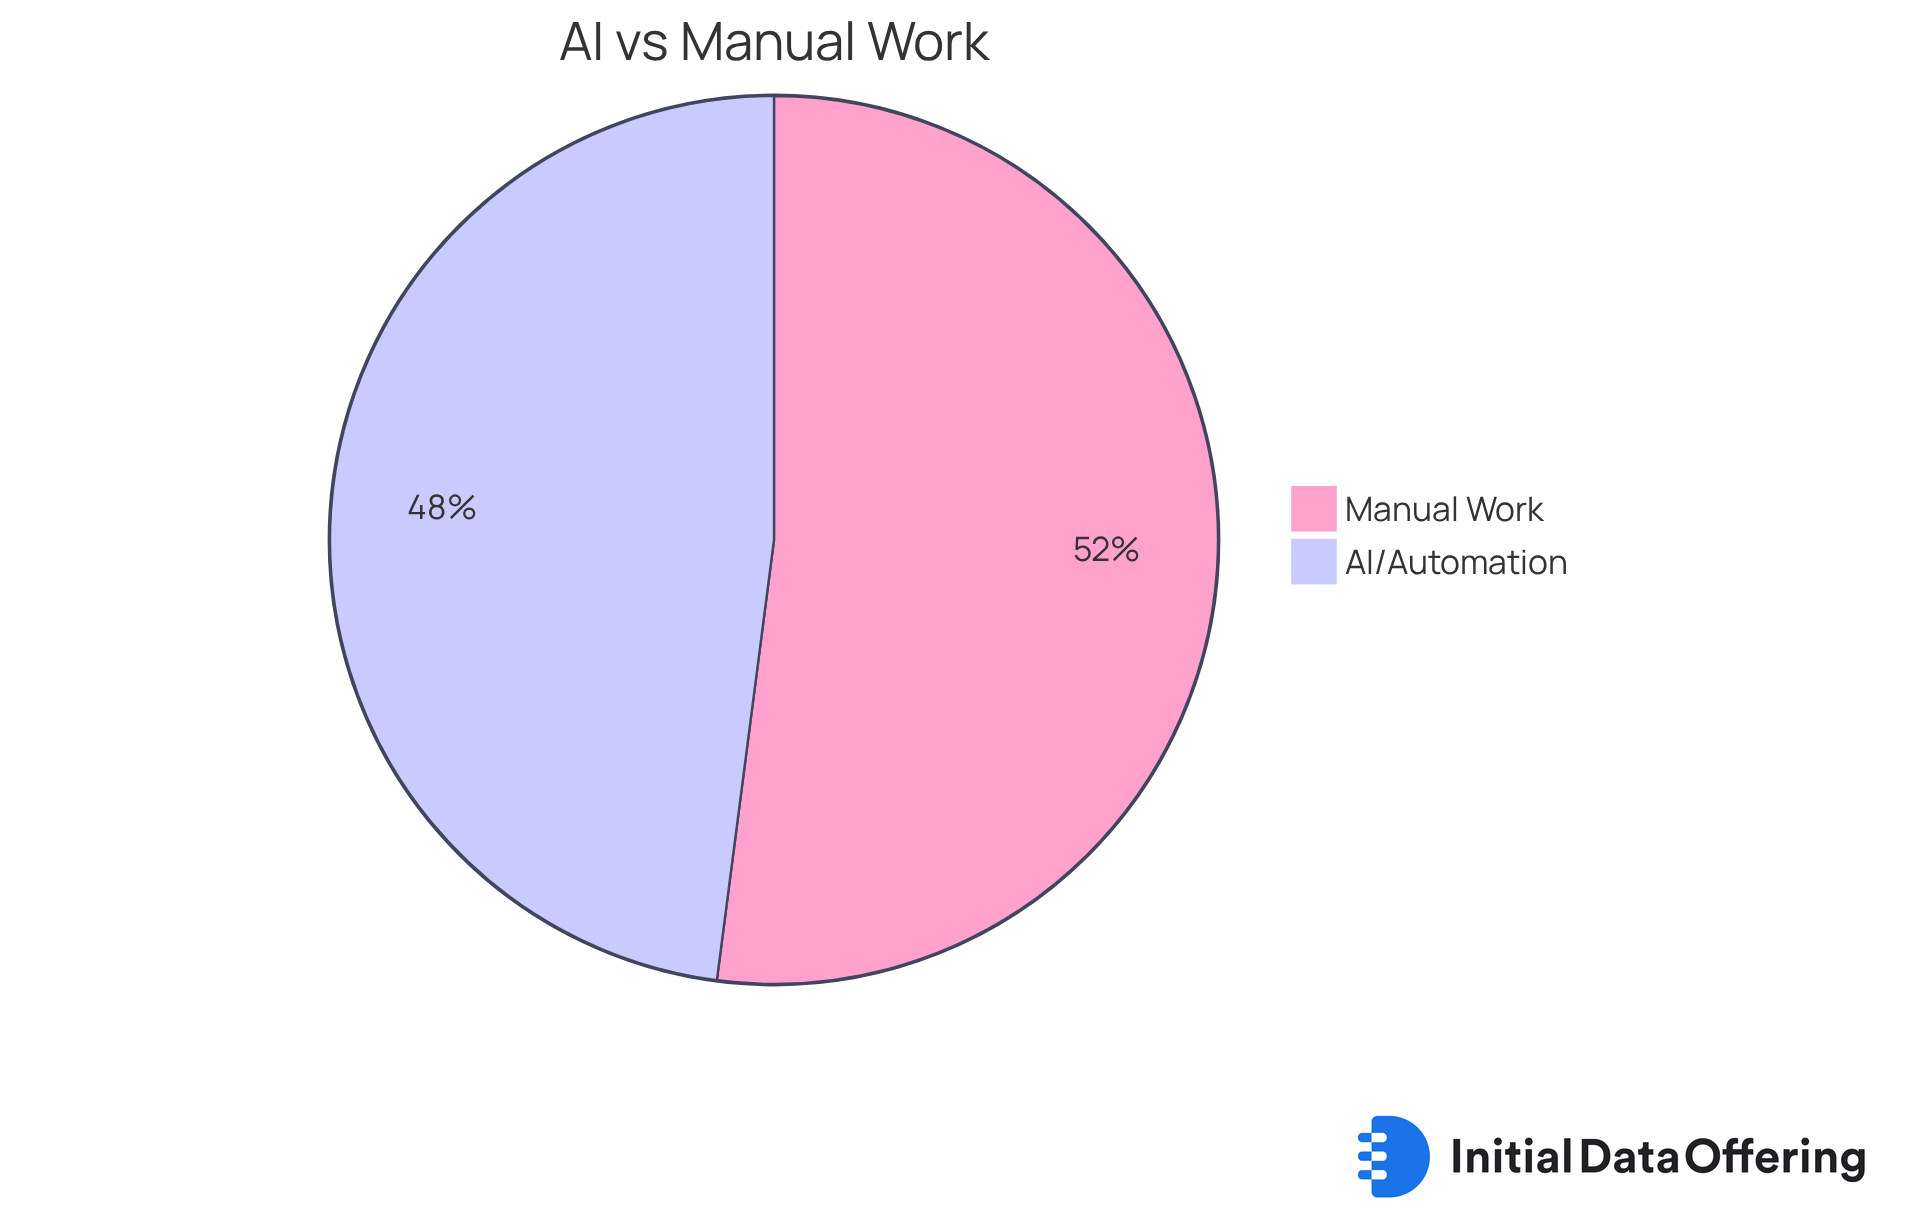
A recent survey indicates that:
- 70% of evaluators believe AI and automation improve their effectiveness.
- 76% still depend on manual spreadsheet work for data preparation.
This highlights the increasing to tackle existing inefficiencies. The capability to automate repetitive tasks not only accelerates the analytical process but also enhances the precision of insights, enabling professionals to react swiftly to changes in the industry. Companies like United Airlines, Hyatt, and Zurich Insurance Group have successfully utilized Alteryx to enhance their decision-making processes, demonstrating the platform's tangible business value.
As organizations increasingly acknowledge the strategic significance of data-driven decision-making, platforms that enable efficient workflows become essential in the arsenal of industry analysis professionals. Furthermore, industry specialists highlight that the incorporation of tools involving artificial intelligence with data science is regarded as a crucial element in expediting daily tasks, with 97% of experts confirming this effect. By effectively utilizing Alteryx, professionals in the field can not only enhance their efficiency but also achieve superior results in their investigative efforts.
Domo: Integrate Data for a Holistic View of Market Insights
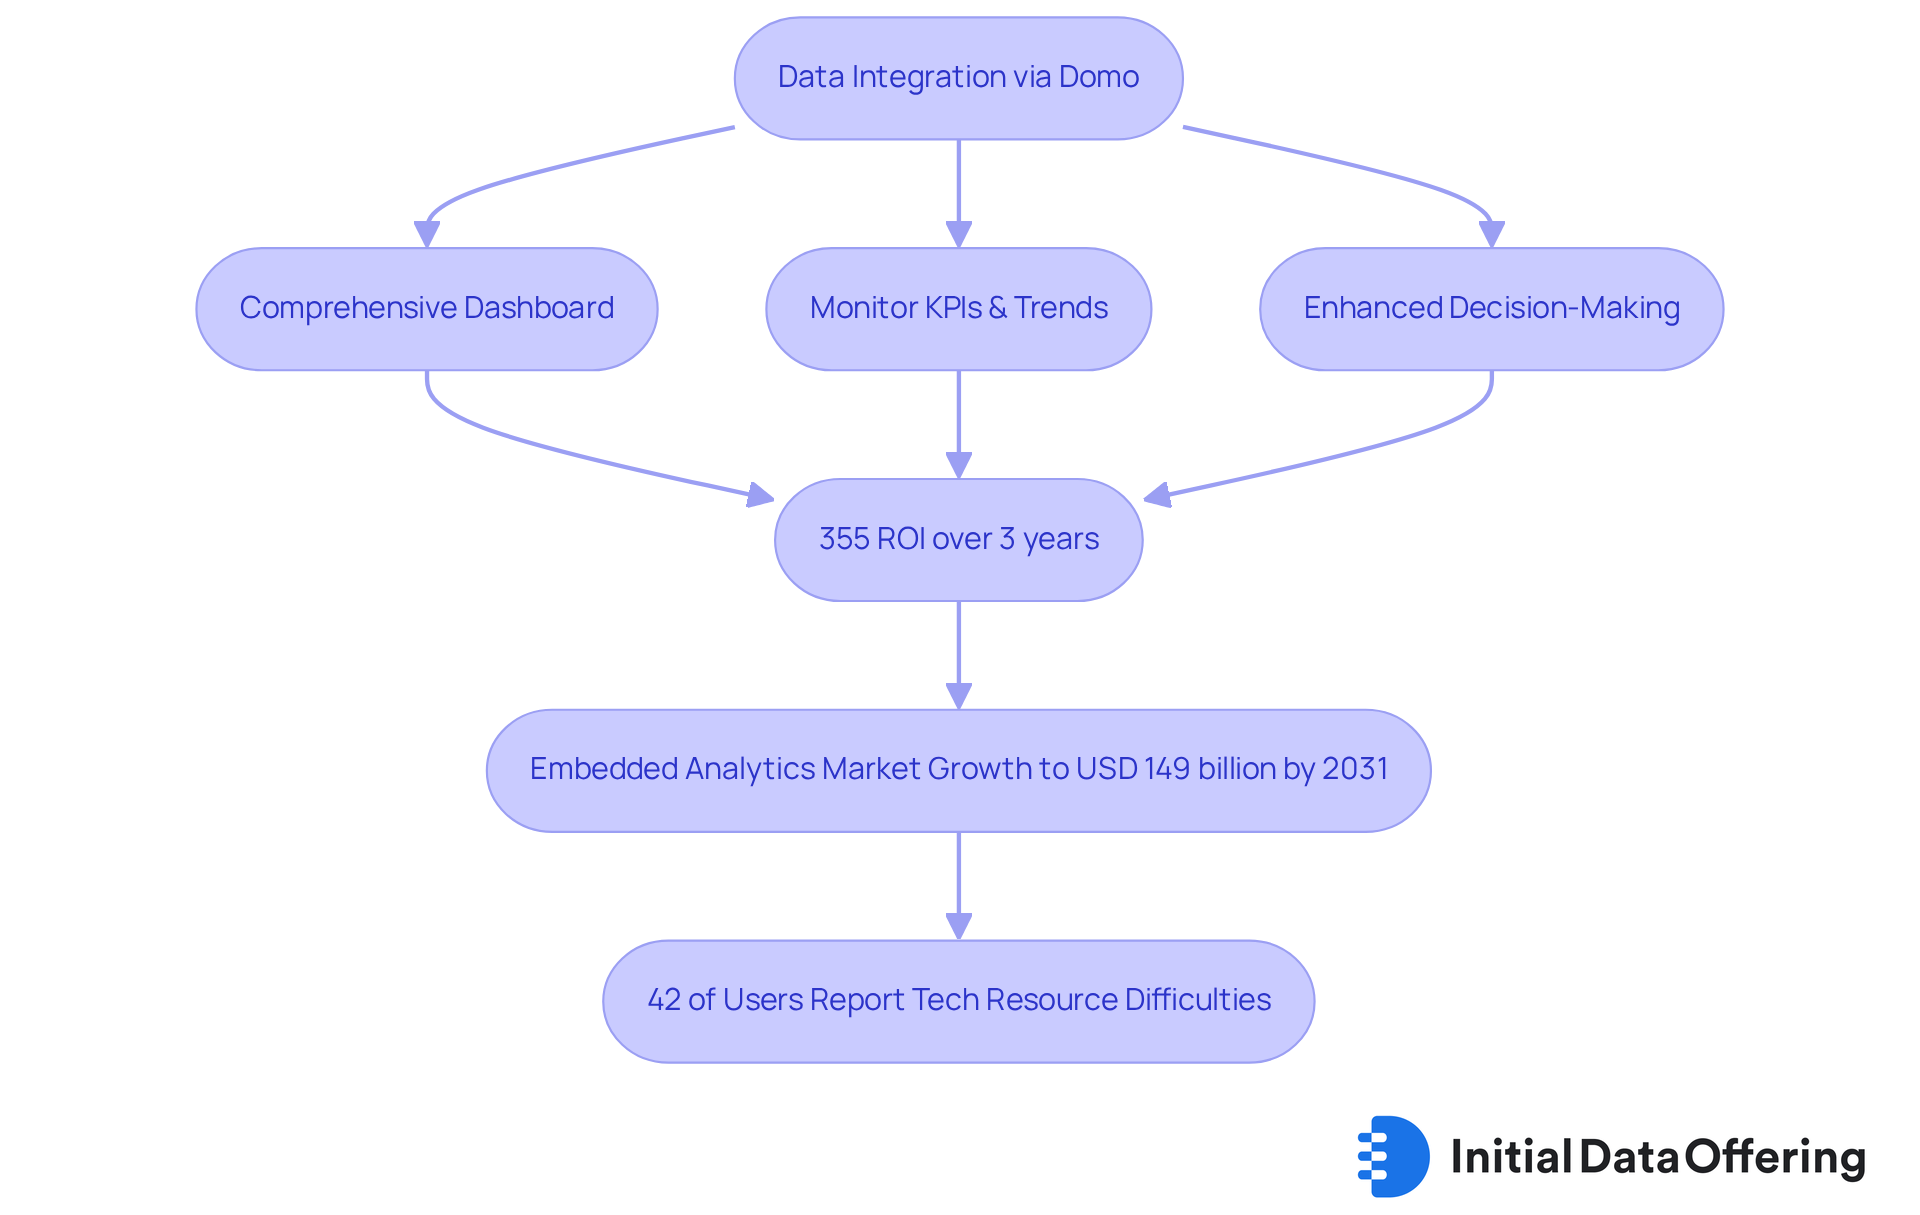
Domo is a robust cloud-based platform that seamlessly integrates information from diverse sources, providing market research professionals with a comprehensive view of market insights. By consolidating data into a single, user-friendly dashboard, analysts can easily monitor key performance indicators and emerging trends. This integrated approach not only simplifies analysis but also significantly enhances decision-making capabilities. Independent studies show that organizations leveraging such comprehensive analysis tools achieve a remarkable 355% over three years, particularly in integration contexts, underscoring the financial benefits of informed decision-making.
As the Embedded Analytics Market is projected to grow to USD 149 billion by 2031, with 81% of analytics users expected to adopt embedded analytics by 2025, the importance of platforms like Domo in delivering actionable insights is paramount. However, organizations encounter hurdles in adopting embedded analytics, with 42% of users reporting difficulties with tech resources. Analysts using Domo have observed that this holistic perspective on market data facilitates more strategic planning and enhances responsiveness to market changes, ultimately leading to improved business outcomes.
How can your organization leverage such insights to drive better results?
Conclusion
The transformative landscape of market research is increasingly shaped by advanced AI tools that enhance data science capabilities. By integrating platforms such as Initial Data Offering, Microsoft Power BI, Tableau, and others, market research analysts can streamline their workflows, derive actionable insights, and ultimately make informed decisions that drive business success. These tools simplify the analysis process and empower professionals to uncover trends and patterns that may have otherwise remained hidden.
Key points throughout the discussion highlight the importance of quality datasets, the role of visualization in decision-making, and the impact of predictive analytics. Each tool presents unique features catering to specific analytical needs—from the intuitive interface of Power BI to the predictive modeling capabilities of RapidMiner. The emphasis on automation and integration underscores the necessity for market research professionals to adapt to these technological advancements to maintain a competitive edge.
As the market continues to evolve, embracing these AI-driven tools is essential for staying relevant in the fast-paced realm of market research. Organizations are encouraged to explore how these platforms can enhance their analytical capabilities, streamline processes, and ultimately lead to better decision-making outcomes. By leveraging the power of AI in data science, market research professionals can unlock new opportunities and drive innovation, ensuring they remain at the forefront of industry trends.
Frequently Asked Questions
What is the Initial Data Offering (IDO) and its purpose?
The Initial Data Offering (IDO) is a platform designed to streamline the launch and discovery of new datasets, specifically for market research professionals. It curates high-quality datasets across various domains to enable analysts to access valuable resources quickly for informed decision-making.
How do quality datasets impact decision-making in market research?
Quality datasets allow analysts to identify emerging trends and shifts in consumer preferences, enabling businesses to adjust their strategies effectively. For example, JPMorgan Chase improved its credit risk evaluation and loan underwriting precision by utilizing extensive analytics.
What trends are emerging in the information marketplace as we approach 2025?
There is a growing emphasis on quality and governance in the information marketplace. The Global Data Quality (GDQ) initiative aims to establish standards for quality metrics, ensuring that researchers can depend on the datasets they utilize.
What role does Microsoft Power BI play in market research?
Microsoft Power BI is a business analytics tool that helps market research analysts convert data into actionable insights. It allows users to create interactive reports and dashboards, facilitating decision-making and enhancing communication with stakeholders.
How does Power BI enhance decision-making through information visualization?
Power BI's advanced features allow professionals to leverage real-time tracking and predictive analytics, informing strategic choices. Its widespread adoption by nearly 30 percent of companies highlights its effectiveness in transforming data into insights.
What are some key features of Power BI that benefit users?
Power BI includes AI-driven functionalities like the new Copilot feature, enabling users to engage with data using natural language. It also offers enhanced role-based access control and mobile app features for intelligent dashboards and push notifications.
How does Tableau assist market evaluation professionals?
Tableau is a visualization tool that empowers professionals to create interactive and shareable dashboards. Its robust connectivity to various information sources helps present complex datasets clearly, enhancing research outcomes.
What benefits do users experience when utilizing Tableau?
Users of Tableau report increased clarity in their findings, which facilitates more strategic recommendations based on data-driven insights. This capability is crucial for navigating the complexity of data in industry analysis as we approach 2025.