6 Essential Data Visualization Platforms for Market Analysts

6 Essential Data Visualization Platforms for Market Analysts
Overview
This article identifies six essential data visualization platforms that are particularly beneficial for market analysts. Each platform offers unique features that cater to the specific needs of analysts, enhancing their ability to extract actionable insights from complex datasets.
-
First, consider Canva, known for its user-friendly design tools. This platform allows analysts to create visually appealing reports and presentations effortlessly. The advantage here is that it simplifies the design process, enabling analysts to focus on data interpretation rather than graphic design. Ultimately, this leads to more effective communication of insights.
-
Next, we have Looker, which excels in in-depth analysis capabilities. Its robust data exploration features empower analysts to dive deep into datasets, uncovering trends and patterns that might otherwise go unnoticed. The benefit of using Looker is clear: it enhances decision-making by providing a comprehensive view of data.
-
Power BI is another noteworthy platform, offering comprehensive analytics that integrates seamlessly with various data sources. This integration allows analysts to visualize data in real-time, making it easier to track performance metrics. The advantage of Power BI lies in its ability to transform raw data into meaningful insights quickly, which is crucial for timely decision-making.
As you explore these platforms, consider how they can enhance your analytical capabilities. Which features resonate most with your current needs? By leveraging these tools, you can significantly improve your data visualization efforts, leading to more informed business strategies.
Introduction
The landscape of data visualization is evolving rapidly, with a growing array of platforms designed to meet the complex needs of market analysts. As organizations strive to make sense of vast amounts of data, the right tools can provide valuable insights that drive strategic decision-making. This article explores six essential data visualization platforms, highlighting their features, advantages, and the benefits they offer users. How might these tools transform the way analysts visualize and interpret data in an increasingly competitive market?
These platforms not only enhance analytical capabilities but also empower users to present their findings in compelling ways. By leveraging these tools, analysts can create visual representations that make complex data more accessible and understandable. This capability is crucial in today’s data-driven environment, where the ability to quickly interpret and act on information can set organizations apart from their competitors.
As we delve into each platform, consider how they can apply to your work. Which features resonate with your analytical needs? The insights gained from these tools could be pivotal in shaping your strategic approach.
Initial Data Offering: Streamlined Marketplace for Unique Datasets
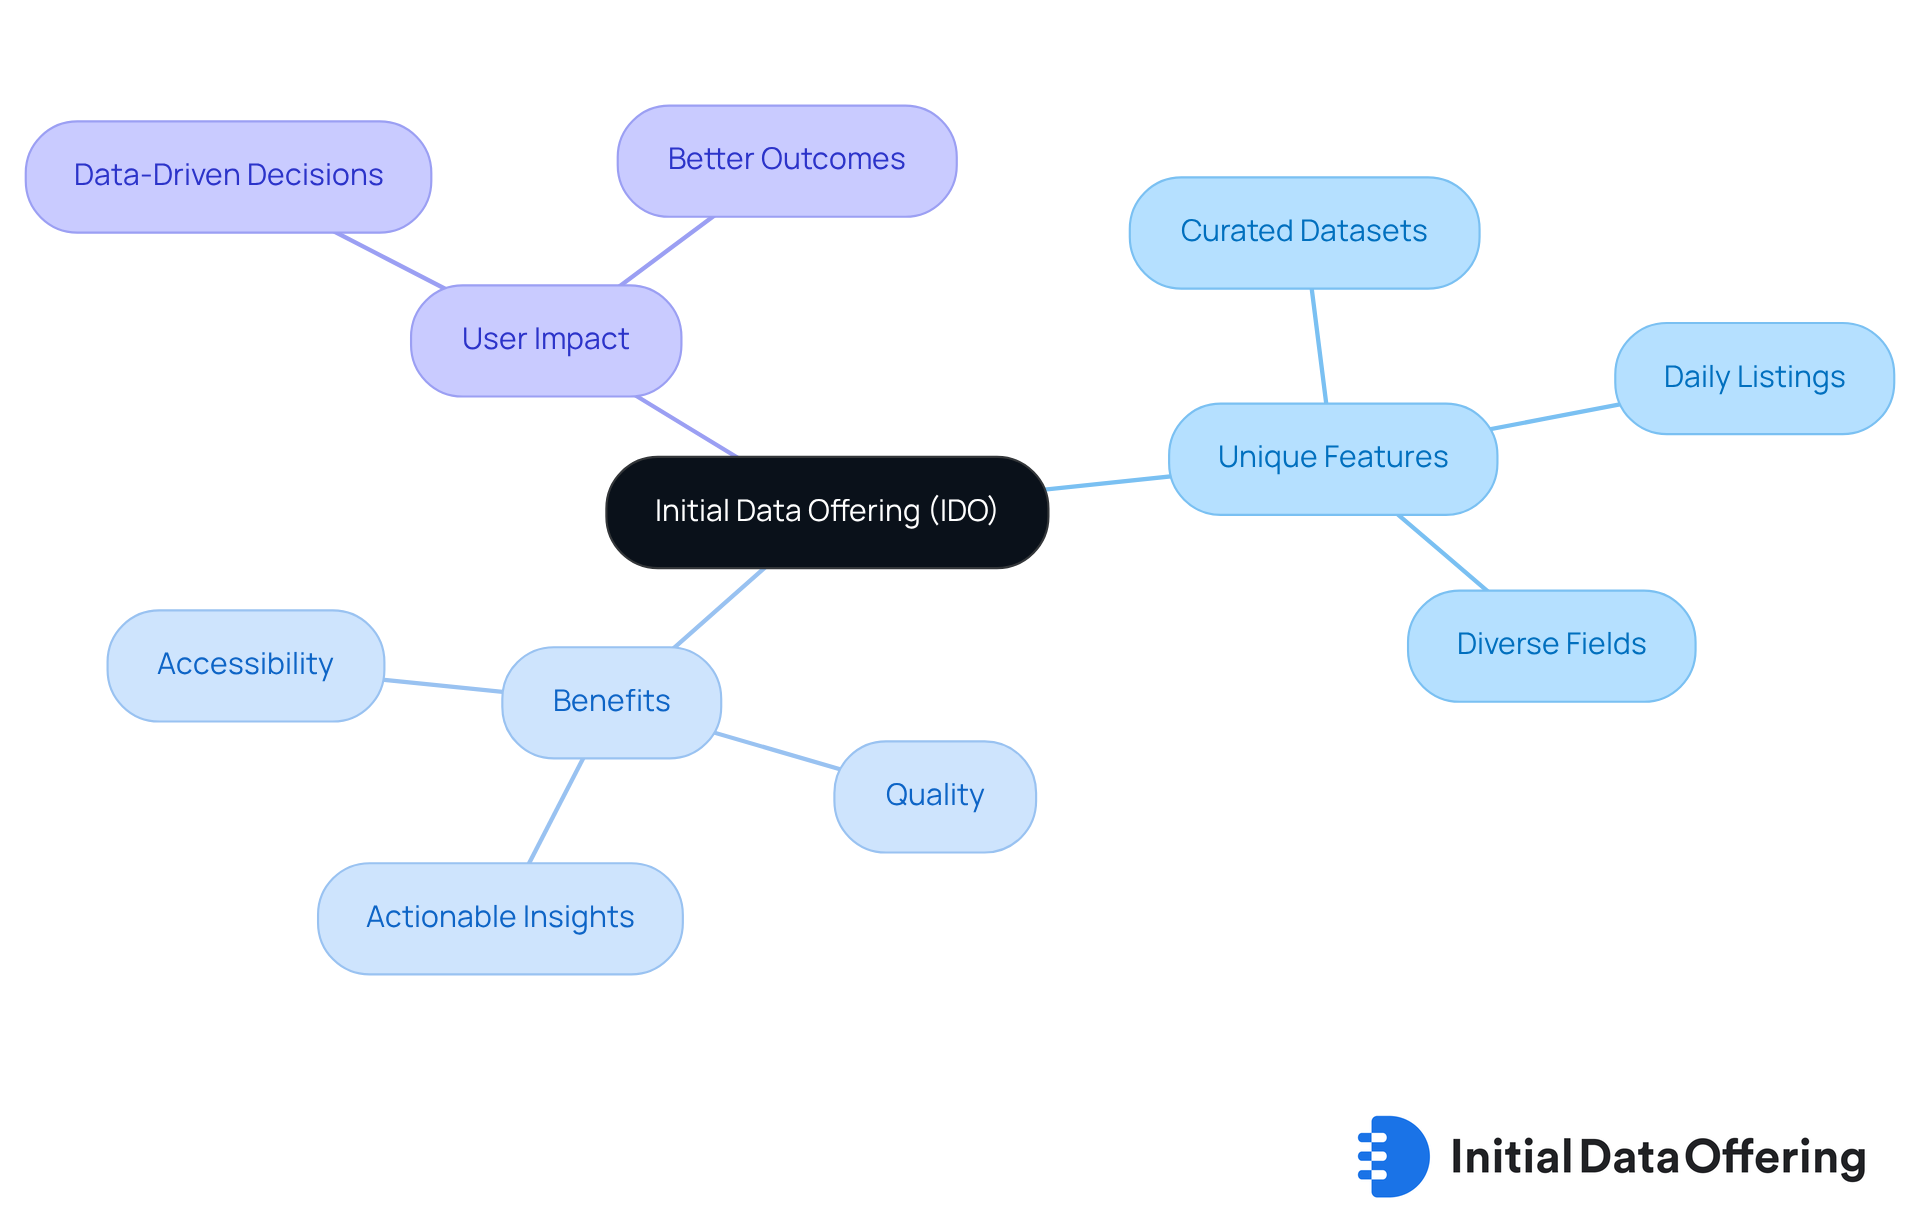
The Initial Information Offering (IDO) serves as a centralized hub for information exchange, streamlining the process of launching and discovering new datasets. What makes IDO stand out? It curates high-quality and unique datasets across diverse fields, such as finance and environmental studies, enhancing accessibility for market analysts. This dedication to quality ensures that users can uncover actionable insights, making IDO an essential resource for informed decision-making.
With new collections listed daily, IDO not only positions itself as a preferred choice for buyers and sellers but also fosters a vibrant community of information enthusiasts. How can these datasets impact your work? By providing reliable and relevant data, IDO empowers users to make data-driven decisions that can lead to better outcomes in their respective fields.
In summary, IDO is more than just a platform; it’s a valuable tool for anyone looking to leverage information effectively. Its commitment to quality and accessibility makes it a go-to resource for market analysts and decision-makers alike.
Canva: Best for Quick and Appealing Data Visualizations
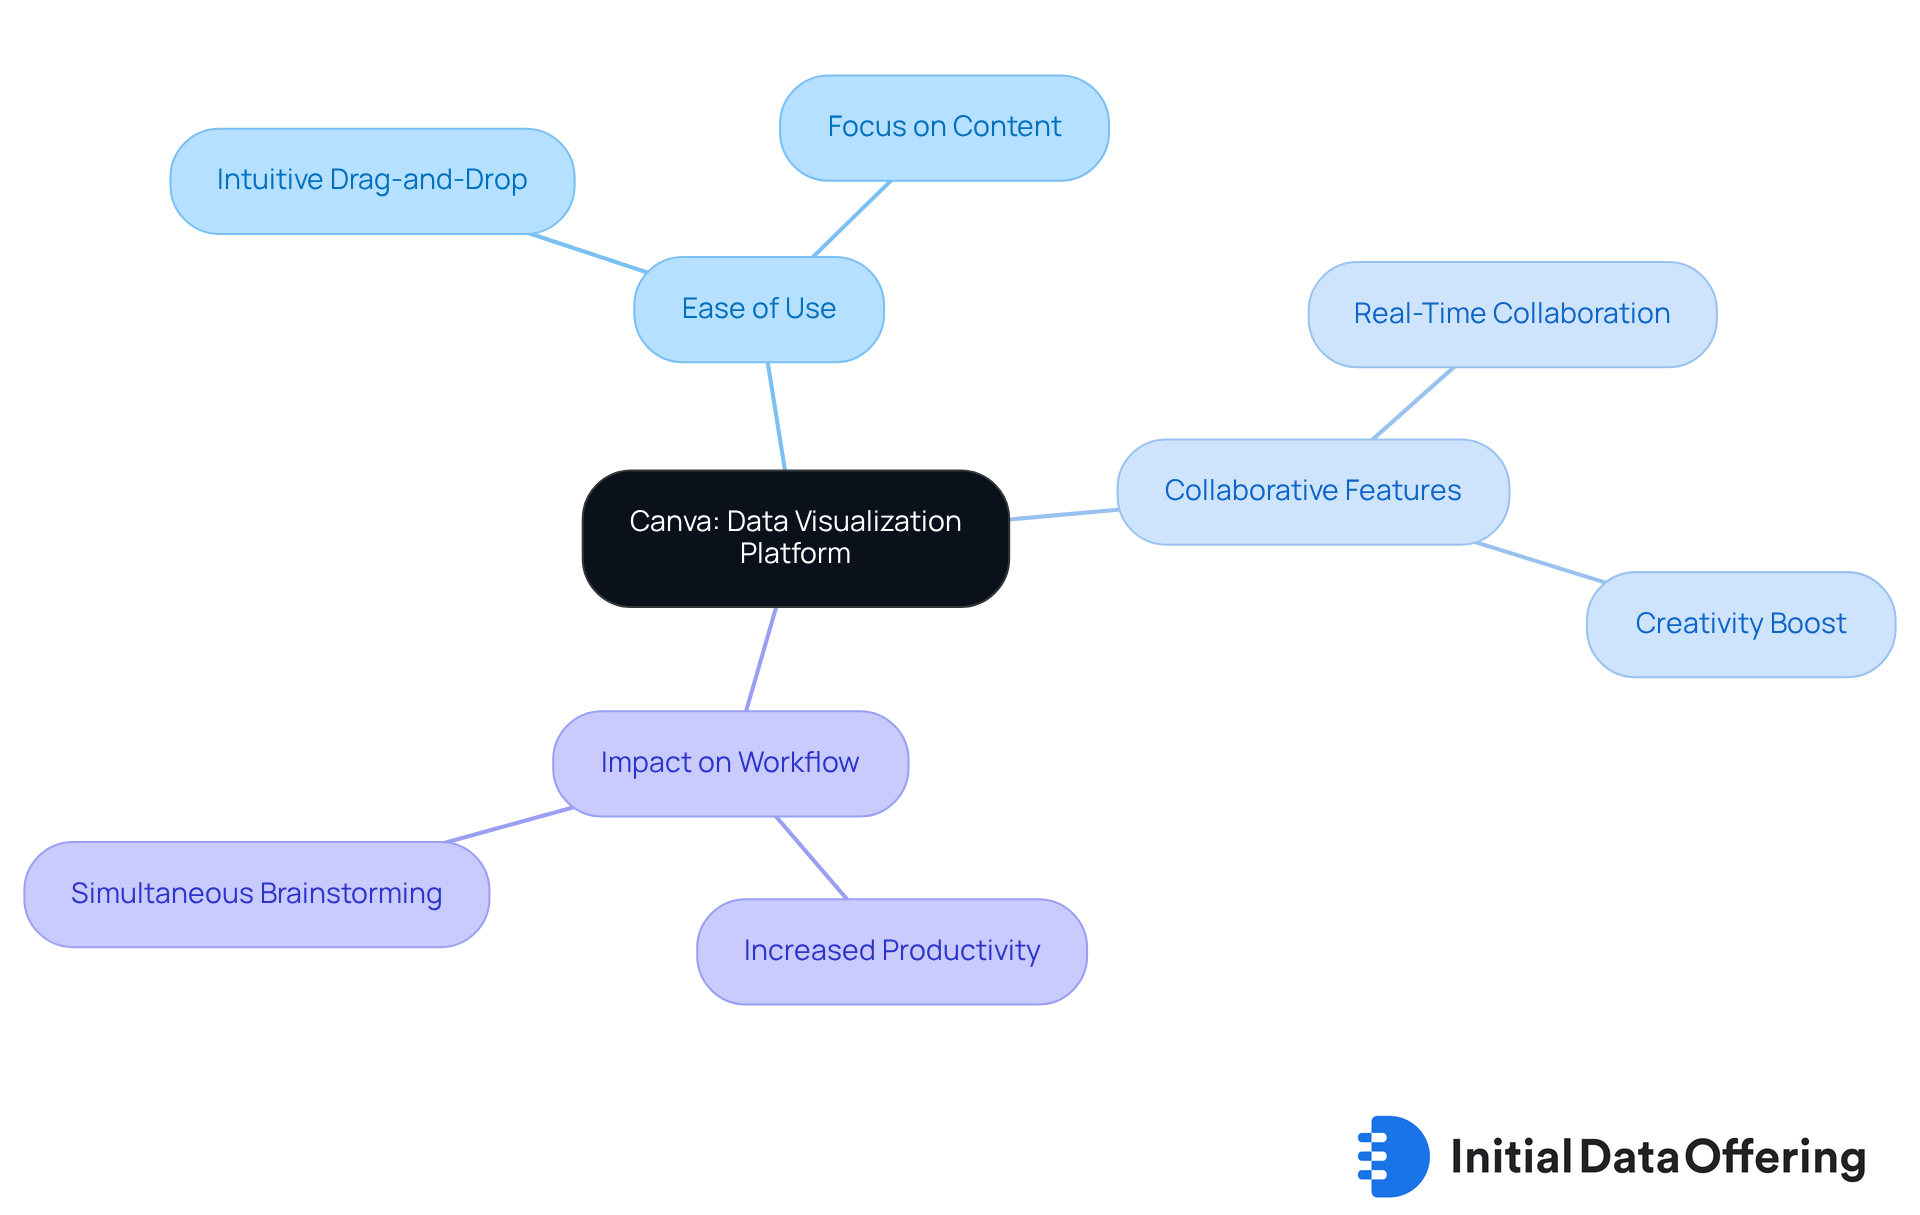
Canva is an exceptional platform among data visualization platforms designed for market researchers who need to create swift and visually appealing representations of data. With a wide array of templates and design elements, users can effortlessly use data visualization platforms to transform raw information into engaging graphics. This feature not only saves time but also enhances the visual impact of the data presented using data visualization platforms.
One of Canva's standout advantages is its intuitive drag-and-drop functionality. This allows for the seamless integration of charts, infographics, and presentations, making it ideal for those who want to convey complex information in an easily digestible format. How might this ease of use improve your workflow? By simplifying the design process, Canva empowers users to focus more on the content rather than the technicalities of graphic design, making it easier to utilize data visualization platforms.
Moreover, Canva's collaborative features enable teams to work together in real-time. This fosters creativity and boosts productivity, as team members can share ideas and make adjustments on the fly. Imagine the possibilities when your team can brainstorm and visualize concepts simultaneously! In summary, Canva not only streamlines the design process but also enhances teamwork, establishing itself as one of the valuable data visualization platforms for any market researcher.
Looker: Best for In-Depth Data Analysis and Business Intelligence
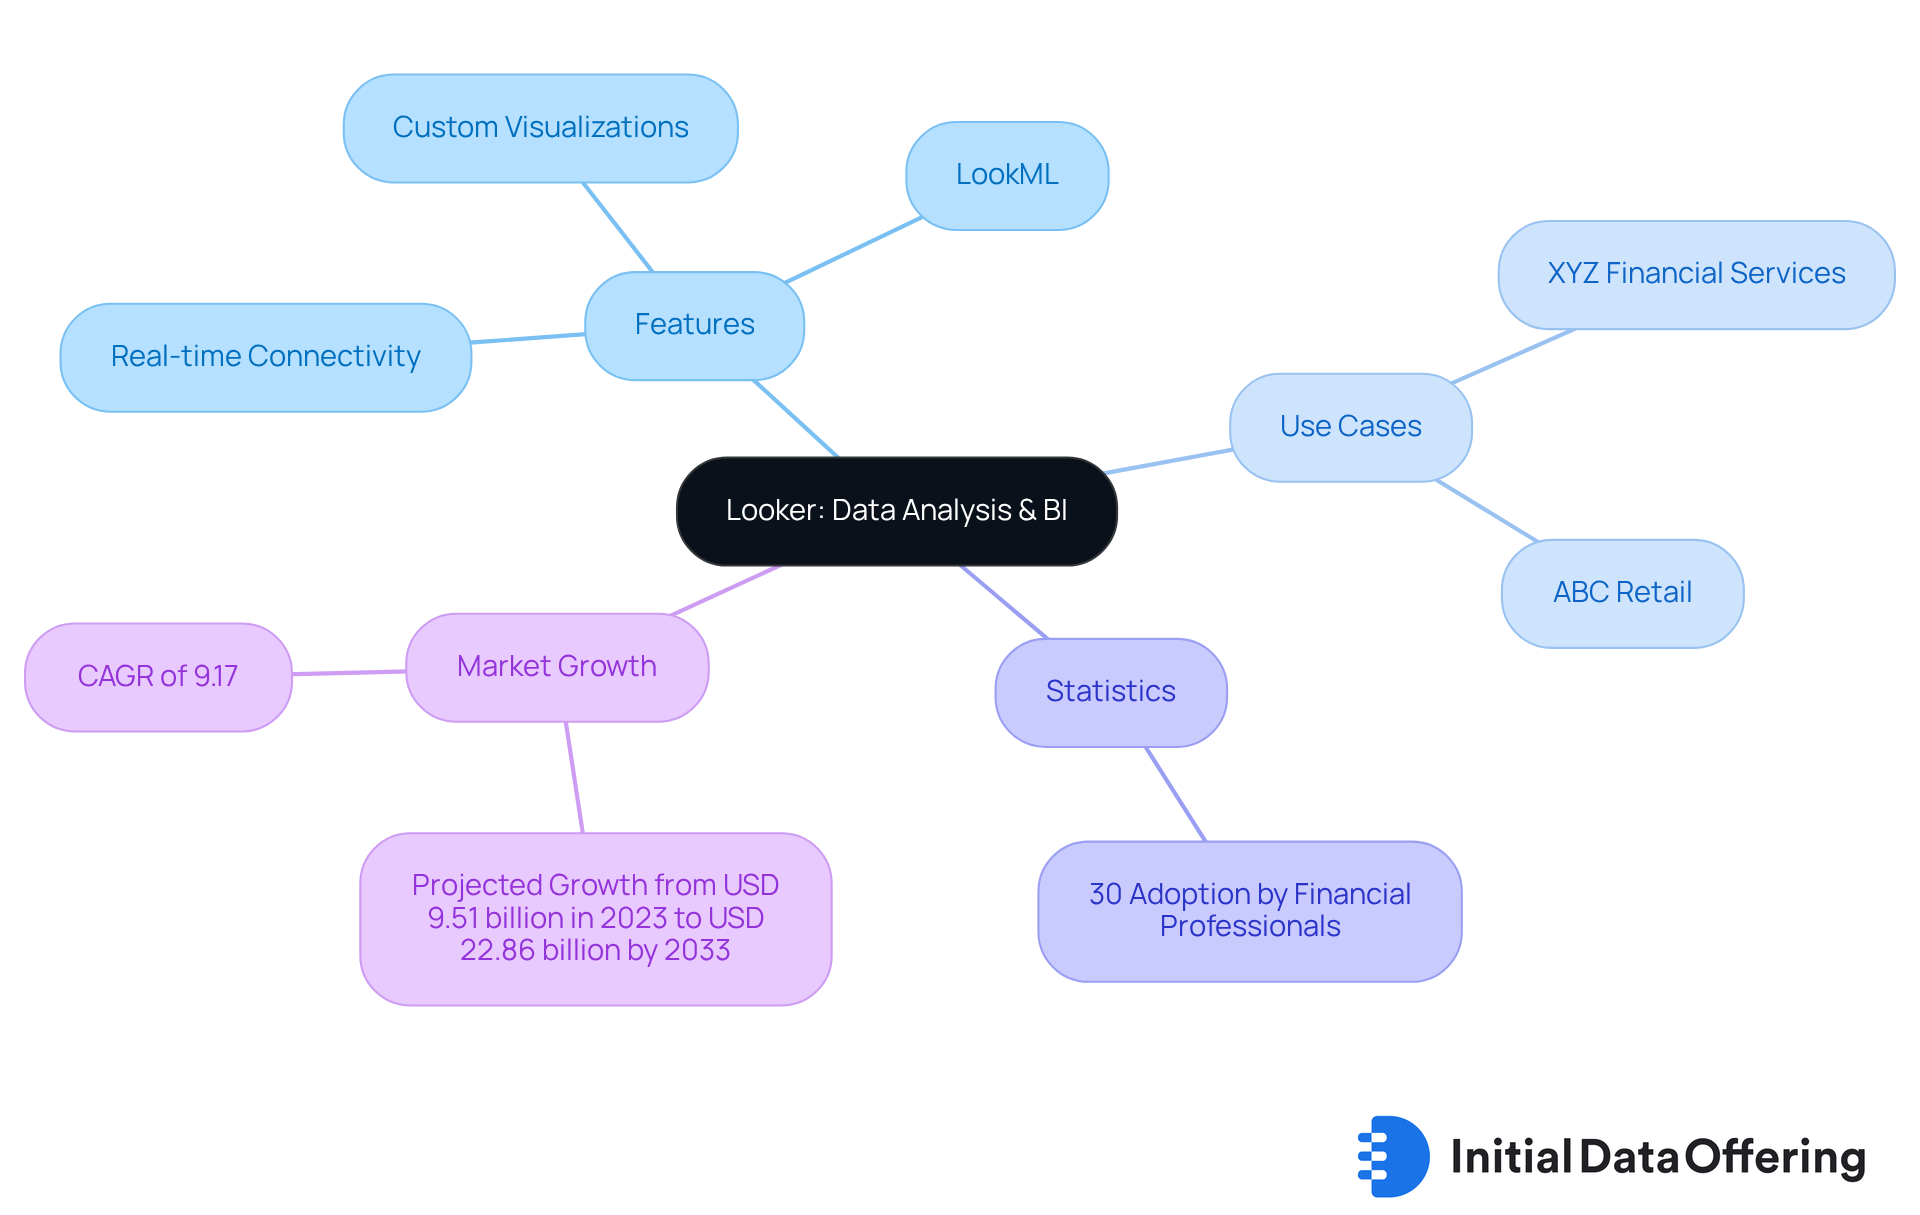
Looker stands out as a premier resource for market researchers focused on comprehensive data analysis and business intelligence. Its direct connectivity to databases enables users to explore information in real-time, which facilitates the generation of insights that inform strategic decisions. The platform's modeling language, LookML, allows analysts to define metrics and dimensions, ensuring consistency across reports. This feature is particularly advantageous for organizations aiming to leverage data for a competitive edge, as it supports complex queries and visualizations tailored to specific business needs.
Organizations that utilize Looker have reported notable improvements in their data-driven decision-making processes. For instance, companies like XYZ Financial Services and ABC Retail have harnessed analytics tools to analyze customer behavior and industry trends, leading to more informed strategies and enhanced operational efficiency. Recent statistics indicate that over 30% of financial professionals use this tool, underscoring its effectiveness in boosting analytical capabilities.
As the demand for interactive data visualization platforms continues to rise, Looker's features position it as an essential tool for market analysts who strive to navigate the complexities of data visualization and analysis effectively. Moreover, with the integration of Artificial Intelligence (AI) and Machine Learning (ML), the platform further enhances its analytical capabilities, enabling users to uncover patterns and insights that were previously challenging to detect. The Global Data Visualization Market is projected to grow from USD 9.51 billion in 2023 to USD 22.86 billion by 2033, at a CAGR of 9.17%. This growth highlights the increasing importance of such tools in the evolving landscape of data analysis.
Looker Studio: Best for Interactive Dashboards and Reporting
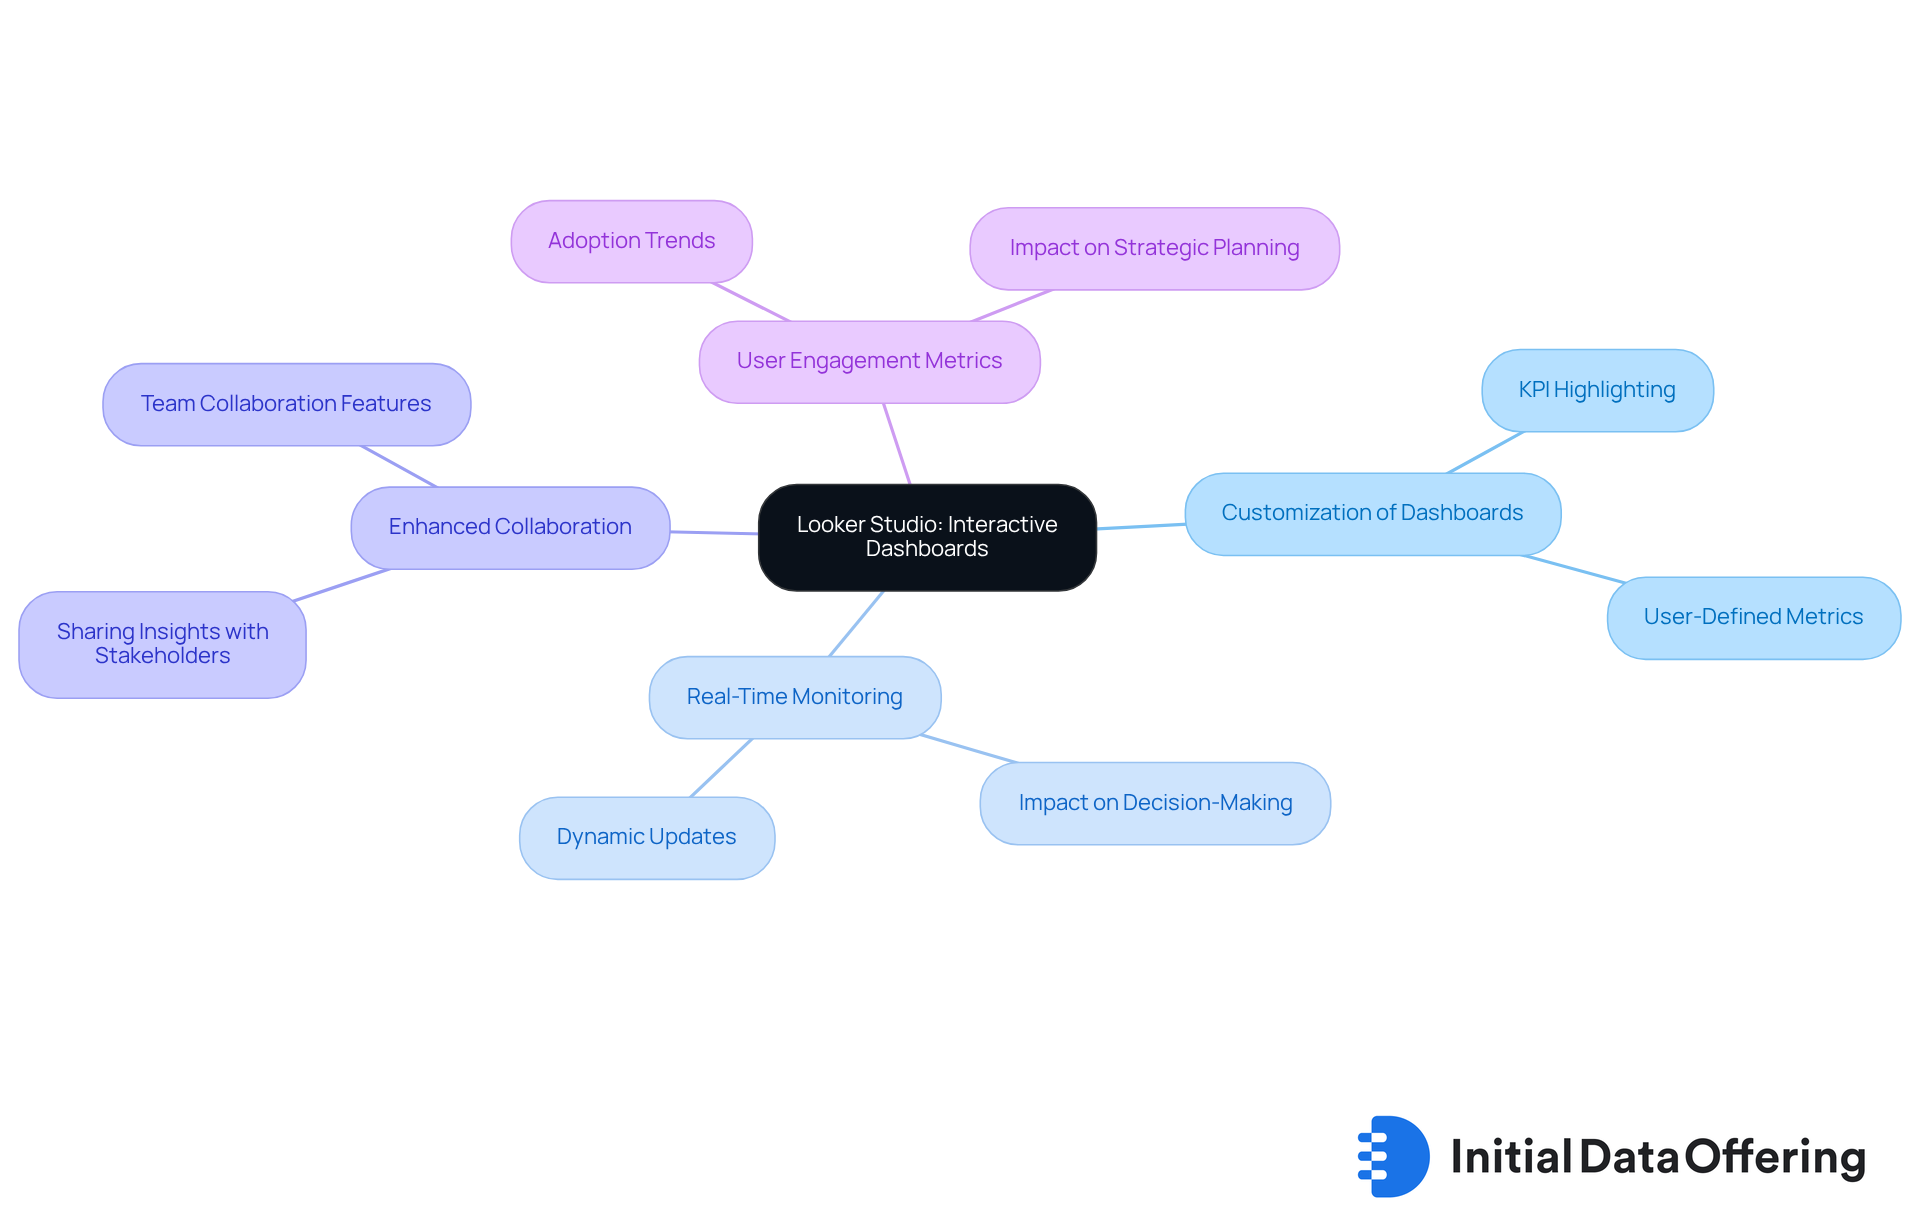
The Studio stands out as a premier example of data visualization platforms for creating interactive dashboards that allow market researchers to visualize information dynamically. One of its key features is the ability for analysts to customize their dashboards to highlight key performance indicators (KPIs) and other vital metrics. This customization facilitates real-time monitoring of business performance, which is crucial for timely decision-making.
The platform's intuitive interface not only simplifies the sharing of insights with stakeholders but also enhances collaboration among teams. By transforming static reports into engaging visual narratives, Looker Studio empowers professionals to drive actionable results effectively. Have you considered how such dynamic visualizations could impact your reporting processes?
Looking ahead to 2025, user engagement metrics suggest a notable increase in the platform's adoption, underscoring its essential role in contemporary data reporting. Market experts emphasize that effective KPI visualization through data visualization platforms is vital for deriving strategic insights, further highlighting their significance in today's data-centric landscape. How might leveraging these insights improve your strategic planning?
MongoDB Atlas: Best for Complex Datasets on a NoSQL Database
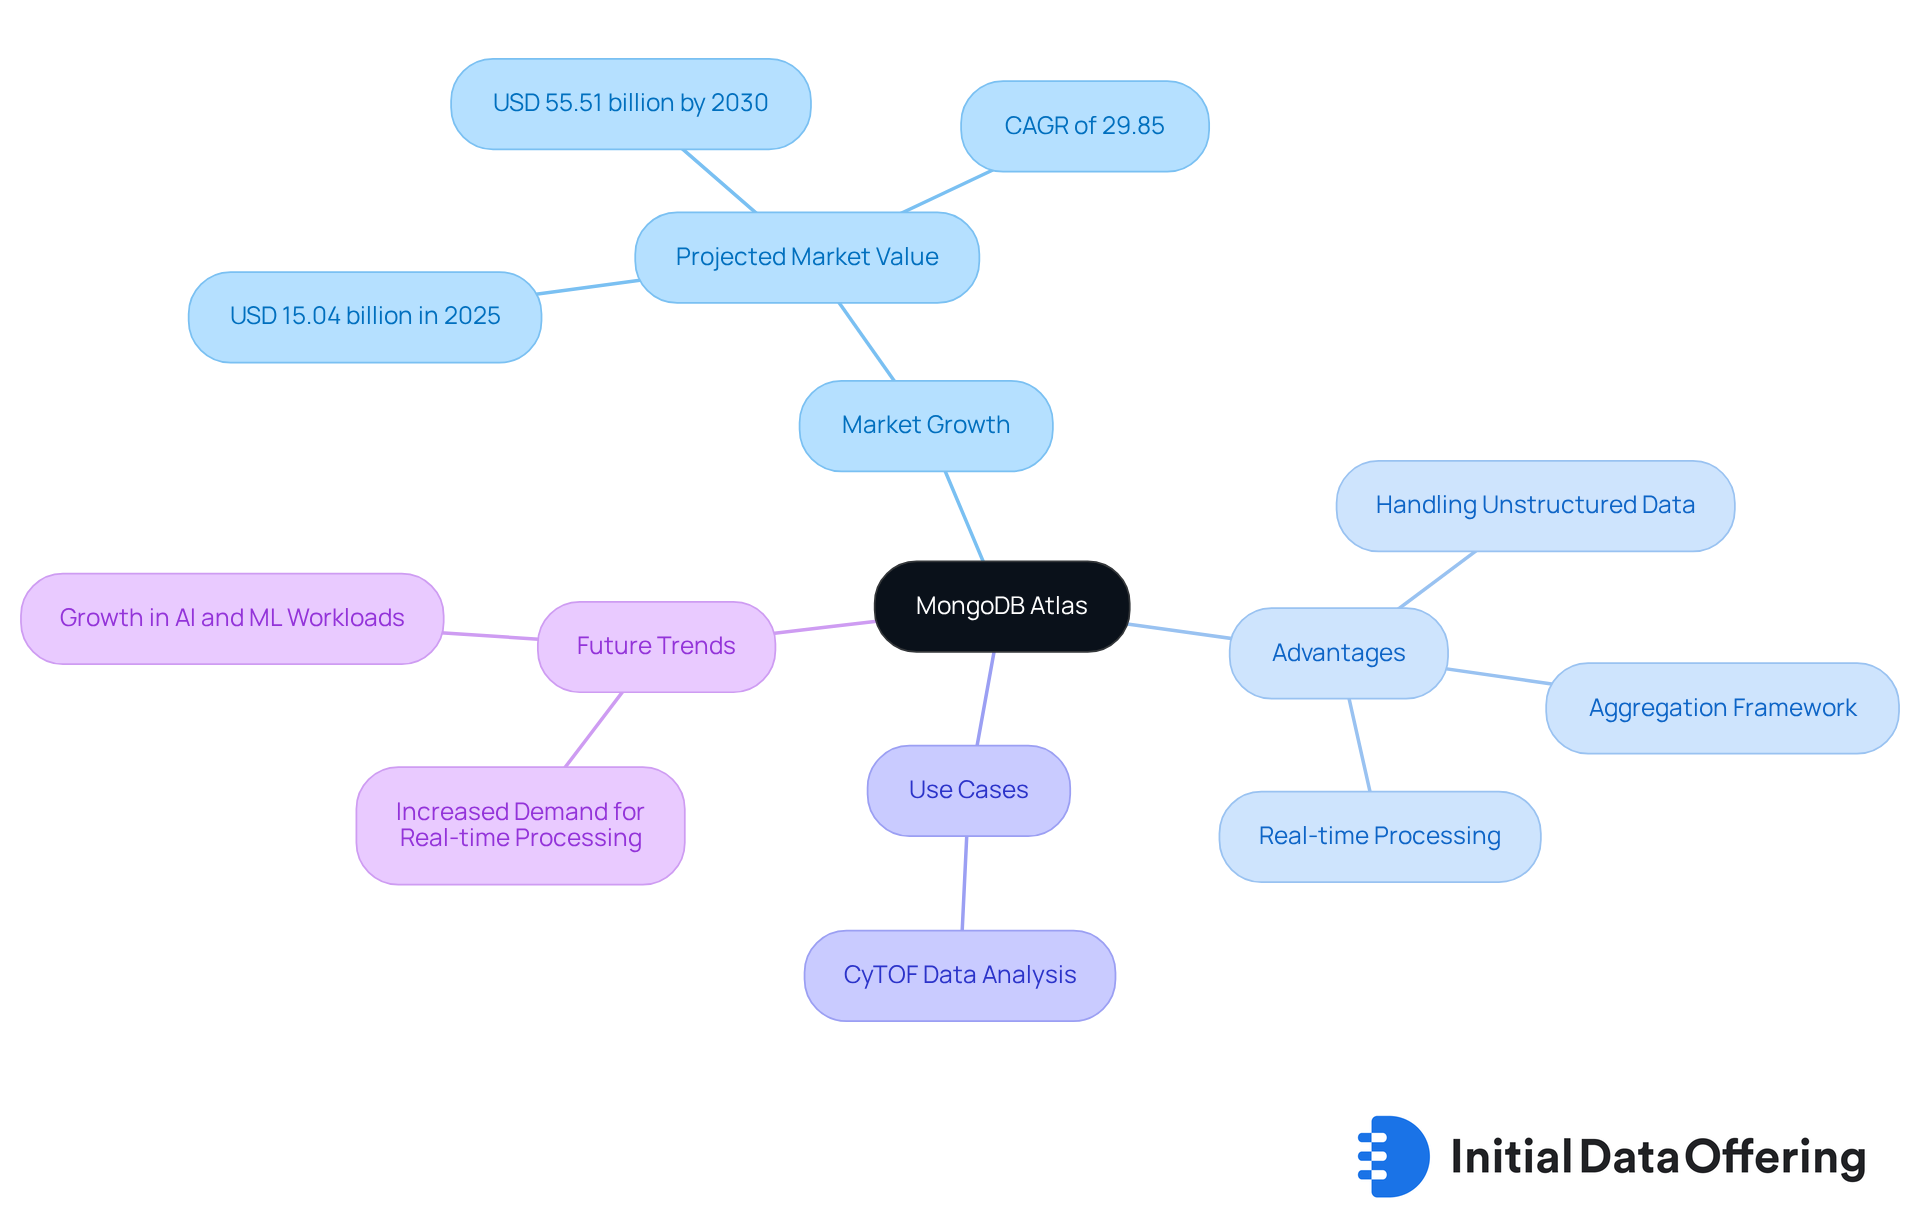
In the current data-driven landscape, MongoDB Atlas stands out as a leading NoSQL database platform, particularly skilled at managing complex datasets. With the NoSQL market projected to grow from USD 15.04 billion in 2025 to USD 55.51 billion by 2030, the significance of flexible database solutions like MongoDB Atlas is clear. Its adaptable schema structure allows industry experts to store and query diverse types of information, making it ideal for projects that demand both agility and scalability.
What advantages does MongoDB Atlas offer? Analysts can leverage its robust aggregation framework to perform advanced analytics, uncovering insights that traditional relational databases often miss. This platform is especially advantageous for organizations dealing with large volumes of unstructured data, facilitating the extraction of meaningful insights from various datasets. As the demand for real-time information processing rises—projected to contribute +8.4% to the NoSQL sector's CAGR—MongoDB Atlas becomes an essential tool for analysts navigating the complexities of modern information environments.
Moreover, as noted by Mordor Intelligence:
- "Key-value stores continue to anchor the NoSQL sector thanks to sub-millisecond response times, while vector search integration is redefining competitive differentiation."
Case studies, such as the analysis of single-cell CyTOF data, further illustrate how advanced analytics can be effectively applied using MongoDB Atlas, showcasing its capabilities in real-world scenarios. How might these features enhance your organization's data strategy?
SAP Crystal Reports: Best for Pixel-Perfect Operational Reports
SAP Crystal Reports stands out as a powerful tool for market researchers in need of pixel-perfect operational reports. What makes it so effective? Its robust reporting capabilities enable users to design highly detailed reports tailored to specific business needs. Analysts can seamlessly combine information from various sources, ensuring comprehensive insights that bolster strategic decision-making.
One of the key features of SAP Crystal Reports is its drill-down functionalities and interactive components. These features allow researchers to present information clearly and professionally, enhancing the impact of their findings. Imagine being able to showcase your data in a way that not only informs but also engages your audience! This capability not only improves the clarity of the reports but also supports better understanding and retention of information.
In conclusion, SAP Crystal Reports offers significant advantages for market researchers. By leveraging its features, analysts can utilize data visualization platforms to create reports that not only meet operational needs but also drive strategic insights. How could these capabilities transform your reporting processes? With the right tools, the potential for impactful discoveries is limitless.
Power BI: Comprehensive Tool for Data Visualization and Analytics
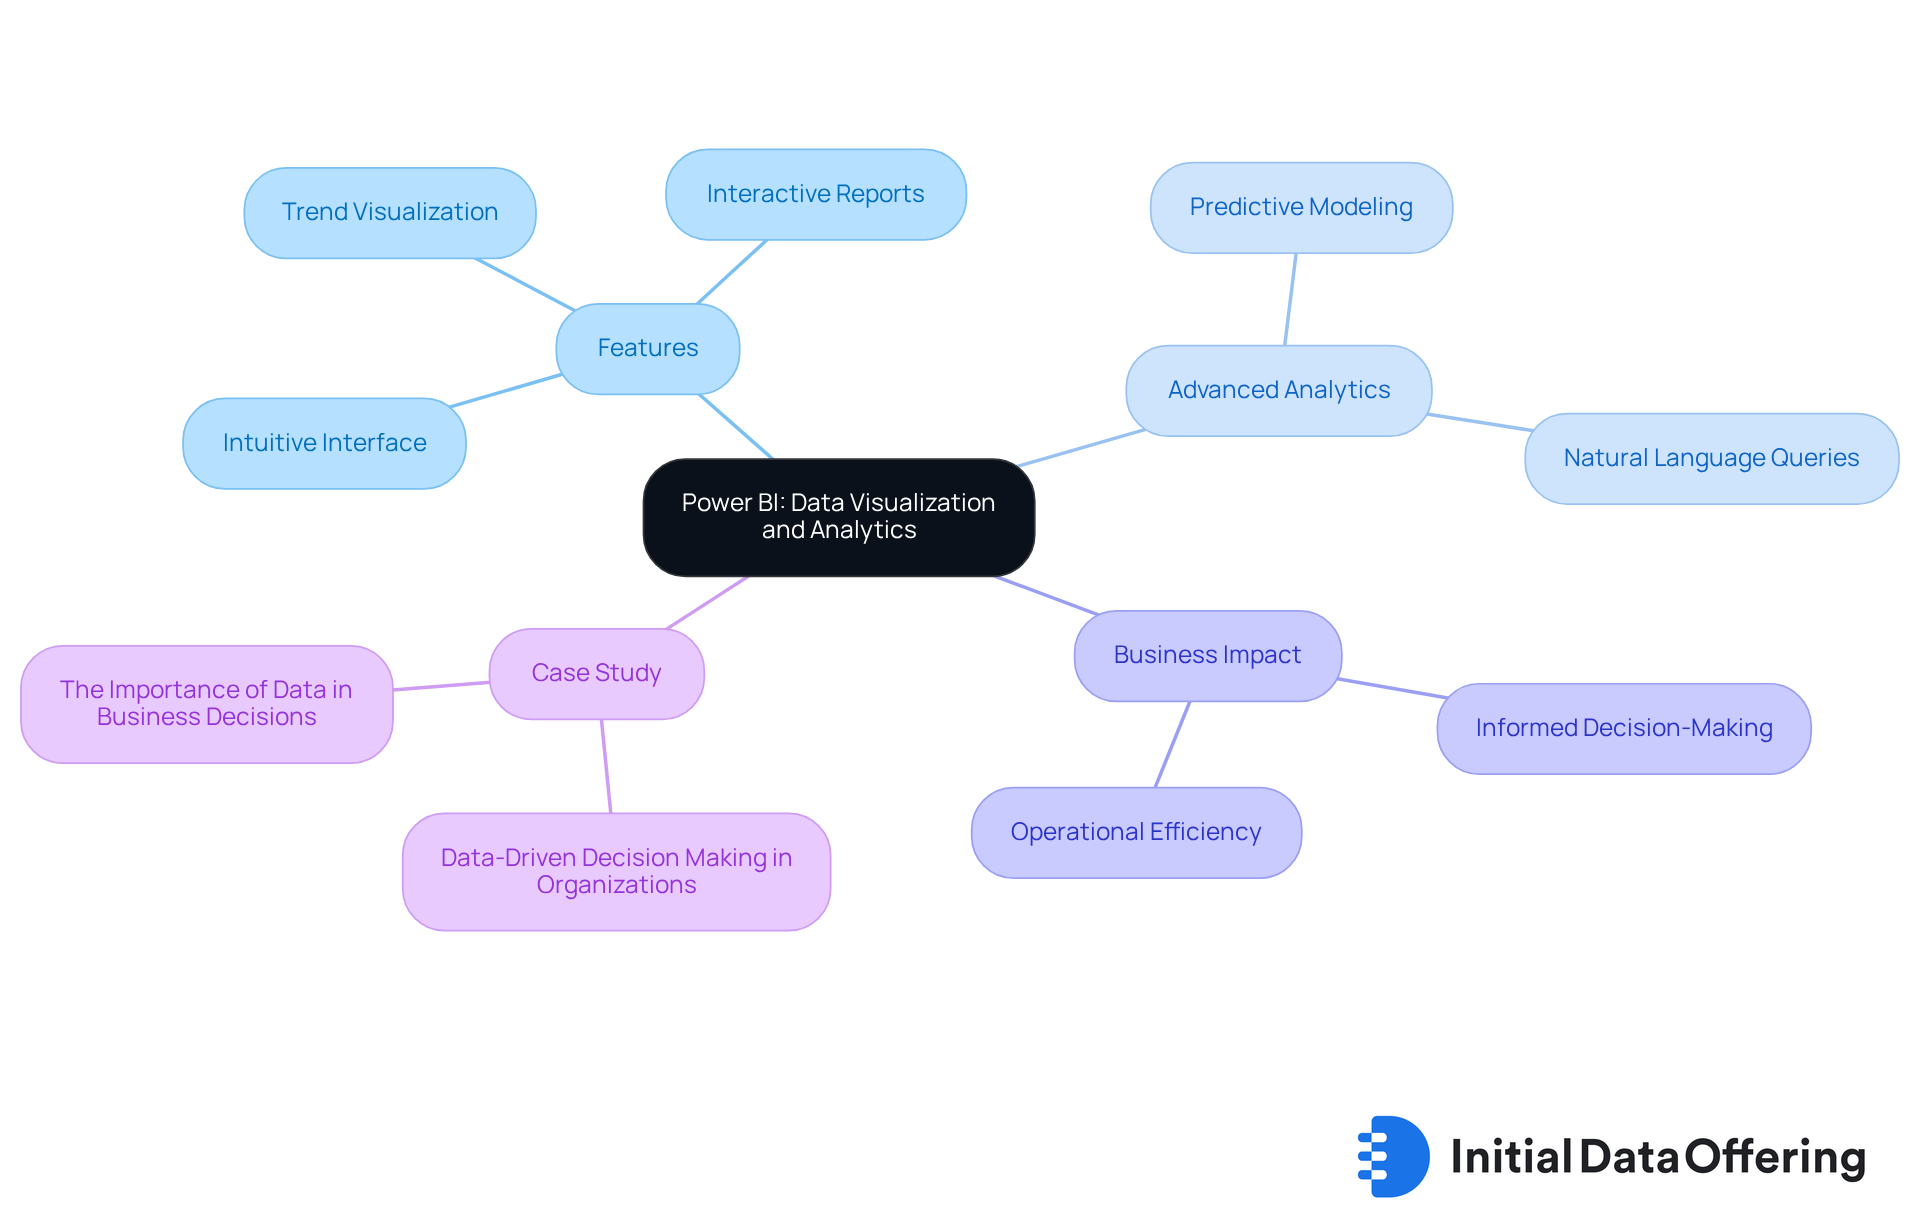
Power BI is a powerful tool that combines visualization and analytics, making it a top choice for market researchers. Its intuitive interface enables users to create interactive reports and dashboards, providing deep insights into business performance. By connecting to a wide array of information sources, analysts can consolidate details and visualize trends effectively.
One of the standout features of Power BI is its advanced analytics capabilities, including predictive modeling and natural language queries. These features empower analysts to uncover hidden patterns and make data-driven decisions with confidence. As Dan Heath aptly states, "Information are merely summaries of thousands of stories—share a few of those narratives to help make the information significant." This highlights how Power BI transforms complex information into actionable insights.
Looking ahead, statistics suggest that consumer information will be the most significant differentiator in the next two to three years. This underscores the essential role of Power BI in enabling insight-driven decision-making. Organizations that leverage Power BI have reported enhanced operational efficiency and improved strategic planning. Many have noted a significant increase in their ability to make informed decisions.
A relevant case study, "Data-Driven Decision Making in Organizations," illustrates how companies effectively utilize data analytics to align their strategies with organizational goals. How can your organization harness the power of data analytics to drive better decision-making? By exploring data visualization platforms such as Power BI, you can unlock the potential of your data and enhance your strategic initiatives.
Conclusion
The exploration of essential data visualization platforms for market analysts reveals a diverse array of tools tailored to meet various analytical needs. Each platform highlighted—from the Initial Data Offering's curated datasets to the interactive capabilities of Looker Studio—serves a distinct purpose in enhancing data comprehension and decision-making. By leveraging these specialized tools, market analysts can transform raw data into actionable insights, ultimately driving strategic outcomes in their organizations.
Key insights from the article emphasize the importance of user-friendly interfaces, collaboration features, and advanced analytics capabilities. For instance, Canva simplifies the design process, making it accessible for all users. Looker and Power BI provide in-depth analytical functions that empower analysts to dive deeper into their data. Meanwhile, MongoDB Atlas excels in managing complex datasets, ensuring that analysts can work efficiently with large volumes of information. Each platform not only aids in data visualization but also empowers analysts to make informed decisions based on reliable information, highlighting the integral role these tools play in the evolving landscape of market analysis.
As the demand for effective data visualization continues to rise, embracing these platforms will be crucial for market analysts aiming to stay competitive. Have you considered how these tools could enhance your analytical capabilities? The future of data-driven decision-making is bright, and organizations that invest in these tools will likely see significant improvements in their analytical capabilities and strategic planning. Harnessing the power of data visualization is not just about presenting information—it's about unlocking the potential of data to inform, engage, and inspire action.
Frequently Asked Questions
What is the Initial Data Offering (IDO)?
The Initial Data Offering (IDO) is a centralized hub for information exchange that streamlines the process of launching and discovering new datasets, curating high-quality and unique datasets across diverse fields.
How does IDO enhance accessibility for market analysts?
IDO enhances accessibility by providing curated datasets that allow users to uncover actionable insights, making it an essential resource for informed decision-making.
What types of datasets can be found on IDO?
IDO features datasets from various fields, including finance and environmental studies.
How frequently are new datasets listed on IDO?
New collections are listed daily on IDO.
What benefits do users gain from utilizing datasets from IDO?
Users gain reliable and relevant data that empowers them to make data-driven decisions, leading to better outcomes in their respective fields.
What is Canva, and who is it designed for?
Canva is a data visualization platform designed for market researchers who need to create quick and visually appealing representations of data.
What features make Canva stand out among data visualization platforms?
Canva offers a wide array of templates, design elements, and intuitive drag-and-drop functionality, allowing users to easily transform raw information into engaging graphics.
How does Canva improve the workflow for users?
Canva simplifies the design process, enabling users to focus more on content rather than technicalities, which enhances the visual impact of the data presented.
What collaborative features does Canva offer?
Canva's collaborative features allow teams to work together in real-time, fostering creativity and boosting productivity as team members can share ideas and make adjustments simultaneously.
Why is Canva considered valuable for market researchers?
Canva streamlines the design process and enhances teamwork, making it a valuable tool for market researchers looking to visualize data effectively.