Master Stock Market Database Strategies for Accurate Insights

Master Stock Market Database Strategies for Accurate Insights
Overview
The article focuses on mastering stock market database strategies to gain accurate insights into financial analysis. It highlights several key features:
- Understanding database structures
- Ensuring data accuracy through validation and audits
- Implementing effective analytical methodologies
- Leveraging new datasets such as alternative and ESG information
Each of these elements offers distinct advantages. For instance, a solid grasp of database structures enhances the ability to navigate and utilize data effectively, while robust validation processes ensure the integrity of the information used in analysis. The benefits of these strategies culminate in improved reliability and depth of market insights, which are essential for informed decision-making.
How can these strategies be applied in your work? By embracing these methodologies, professionals can significantly enhance their analytical capabilities. The integration of alternative datasets and ESG information not only broadens the scope of analysis but also aligns with the growing demand for comprehensive financial insights. This approach not only fosters better decision-making but also positions analysts to respond adeptly to market changes. Thus, mastering these strategies is not merely advantageous; it is imperative for success in today’s dynamic financial landscape.
Introduction
Understanding the intricacies of stock market databases is essential for analysts aiming to navigate the complex financial landscape. By mastering foundational structures and methodologies, professionals unlock valuable insights that drive informed decision-making and strategic investment choices.
However, with the rapid evolution of data sources and analytics techniques, how can analysts ensure they leverage the most effective strategies to enhance their market insights?
This article explores best practices for stock market database strategies, offering a roadmap to achieve accuracy and reliability in financial analysis.
Understand Stock Market Database Structures
To effectively examine financial exchange information, one must first grasp the foundational database frameworks. Common structures include relational databases, which arrange information into tables, and time-series databases, optimized for managing information indexed by time. Understanding these frameworks is essential for analysts, as they provide the basis for accurate data interpretation and analysis.
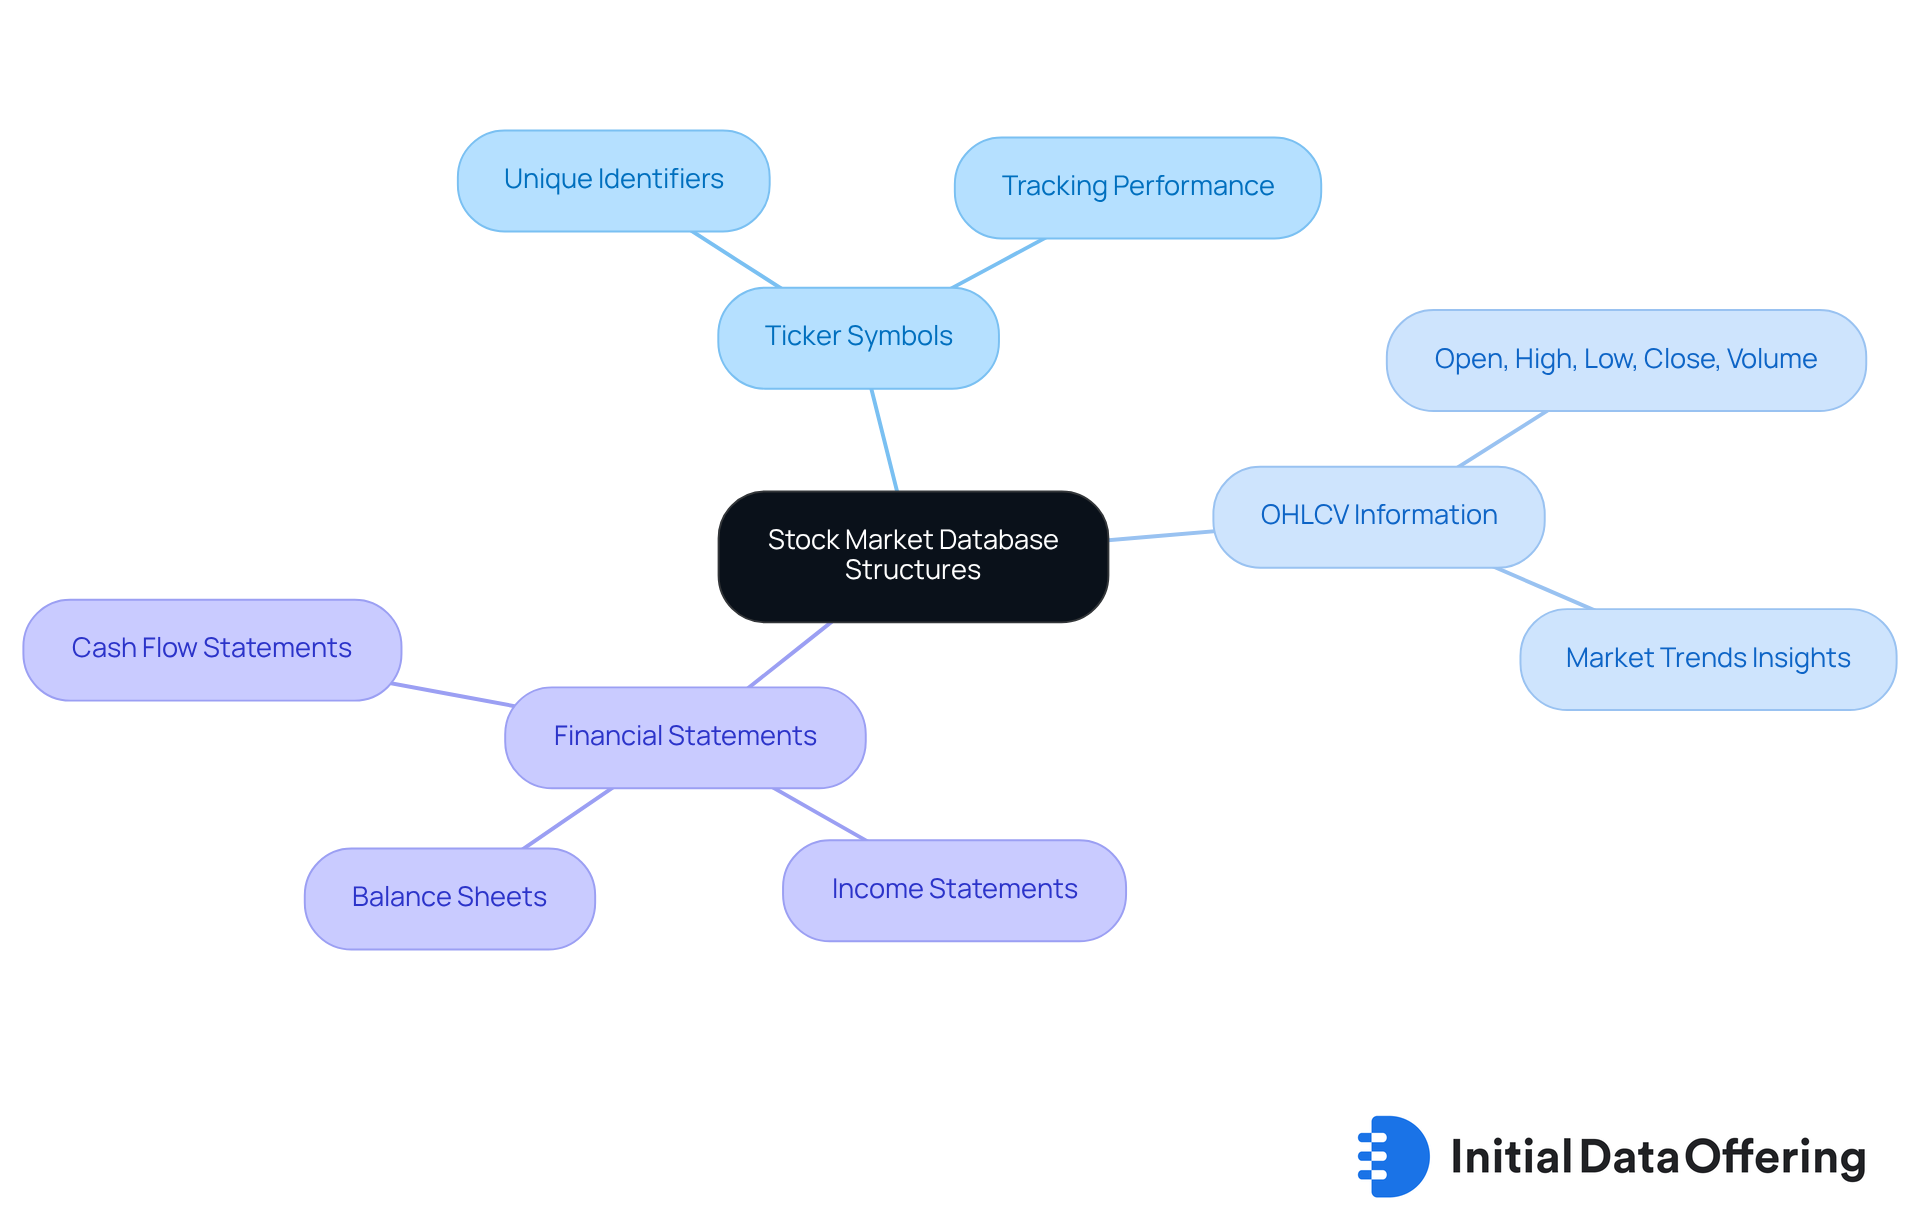
Key components of stock market databases typically include:
- Ticker Symbols: Unique identifiers for each stock, essential for tracking performance. This feature allows analysts to quickly access and compare stock data, enhancing their analysis.
- OHLCV Information: Open, High, Low, Close, and Volume metrics from the stock market database provide a thorough perspective on market performance over time. These metrics provide valuable insights into market trends and investor behavior, enabling informed decision-making.
- Financial Statements: Tables that include income statements, balance sheets, and cash flow statements, which are crucial for fundamental analysis within the stock market database. By analyzing these statements, analysts can assess the financial health of companies, leading to strategic investment choices.
By familiarizing oneself with these structures, analysts can better navigate the information landscape. This knowledge not only enhances their analytical capabilities but also leads to more informed decision-making and strategic insights. How might these frameworks apply to your current analysis? Understanding them can significantly improve your ability to interpret complex financial data.

Ensure Data Accuracy and Reliability
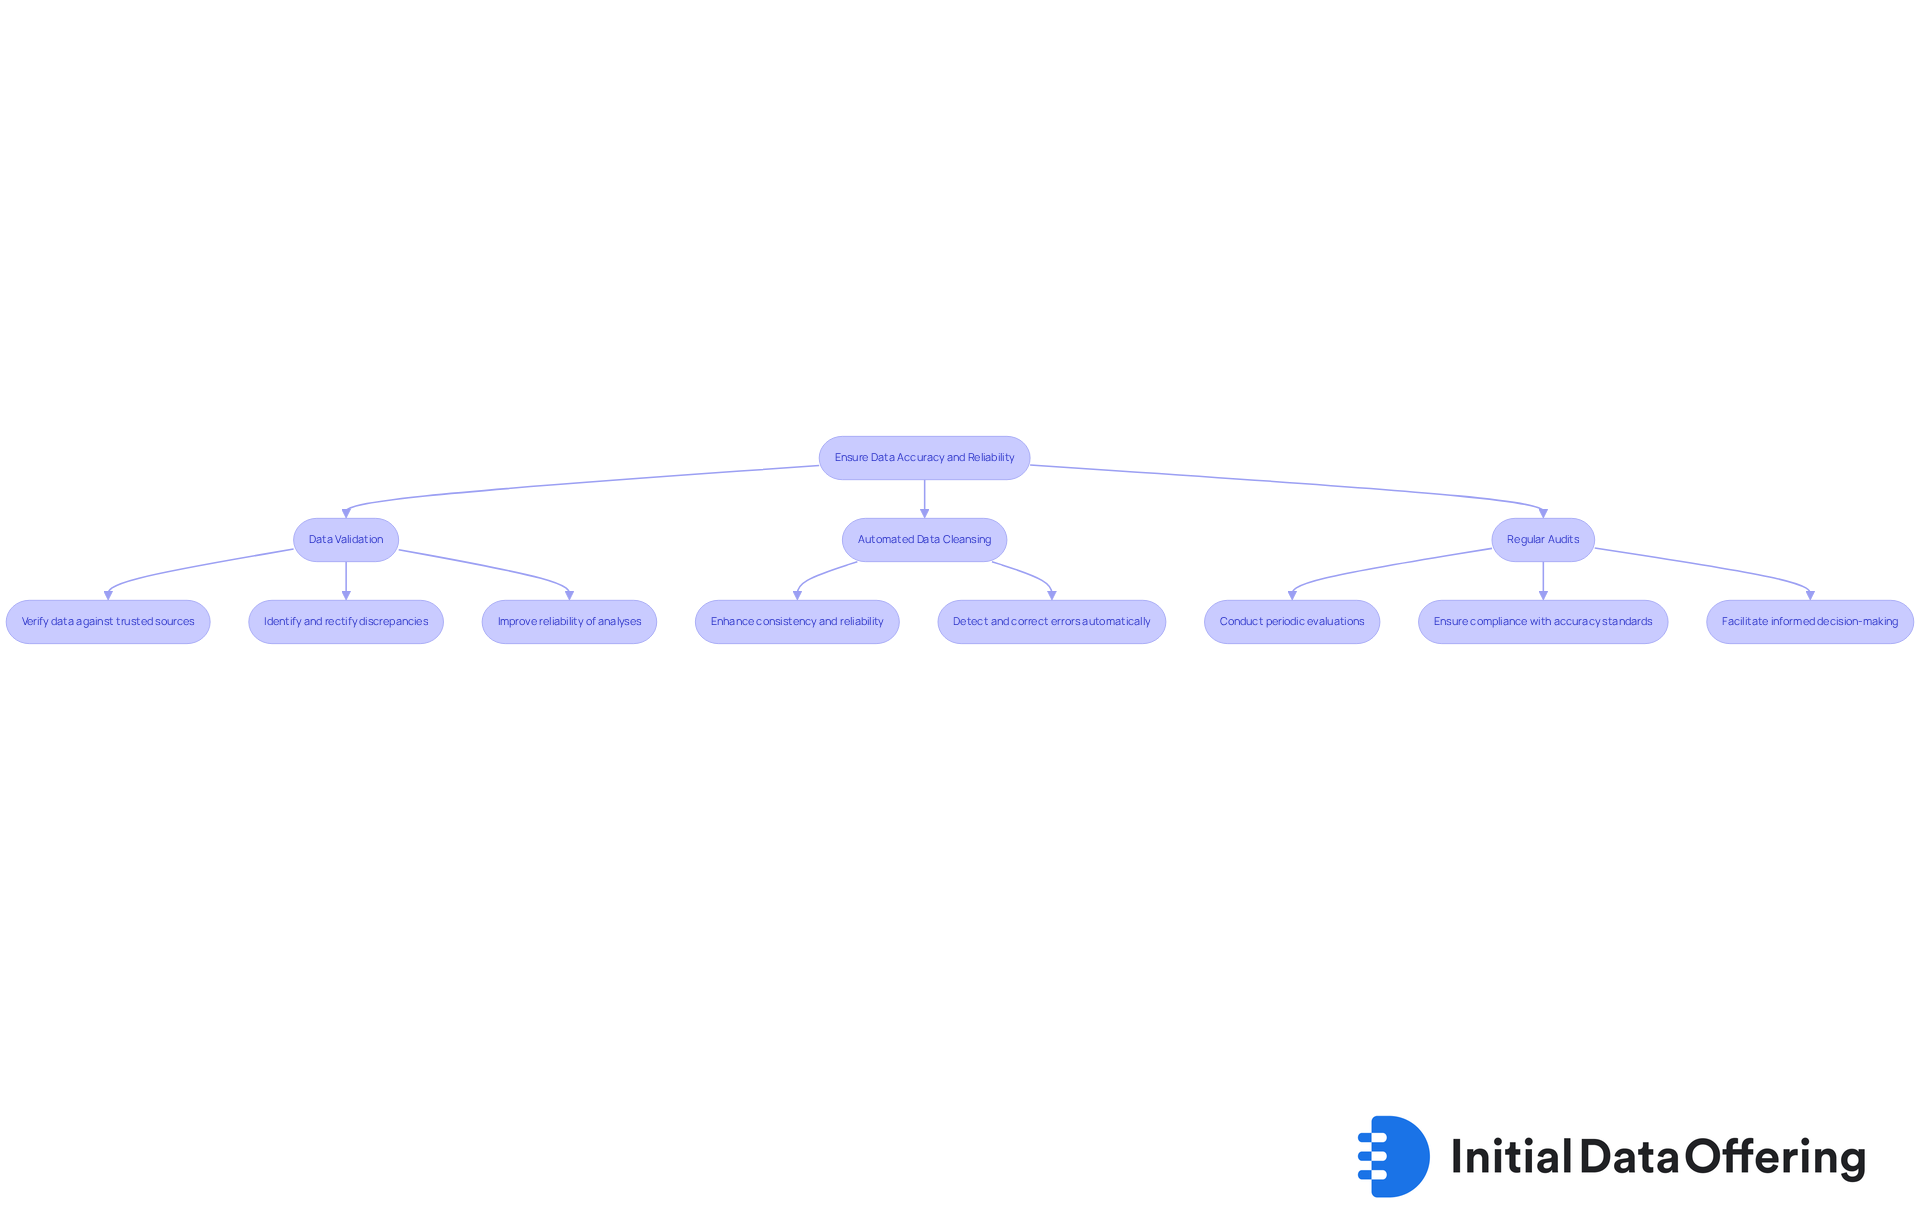
To ensure data accuracy and reliability in stock market analysis, it is essential to adopt best practices that enhance the integrity of the stock market database.
Data Validation involves regularly verifying data entries against trusted sources to identify and rectify discrepancies. This practice is crucial for preserving the integrity of financial datasets, as precise information offers insights into profitability, liquidity, and overall financial stability. By implementing robust validation processes, analysts can significantly improve the reliability of their analyses and decision-making.
Automated Data Cleansing leverages advanced software tools designed to automatically detect and correct errors within datasets. These tools enhance consistency and reliability, significantly impacting the accuracy of stock market database analysis. For instance, automated information cleansing simplifies the process of identifying outliers or discrepancies, enabling analysts to concentrate on extracting actionable insights. As Veda Bawo observed, "Good information quality is essential; without it, fancy tools are ineffective." This underscores the importance of integrating technology into data management practices.
Regular Audits involve conducting periodic evaluations of information sources and processes to ensure compliance with established accuracy standards. Frequent evaluations assist in recognizing possible mistakes while also strengthening the significance of information quality in decision-making processes. Audits can help identify errors and ensure financial information is accurate, thereby enhancing the reliability of analyses.
For example, a top 10 global bank required an instant payment service to process transactions in real-time while ensuring reliability and compliance with regulations. By establishing a thorough information governance framework that includes automated checks and balances, the bank significantly lowered the risk of mistakes in their datasets. This proactive approach not only improves information quality but also facilitates informed decision-making and strategic planning.

Implement Effective Data Analysis Methodologies
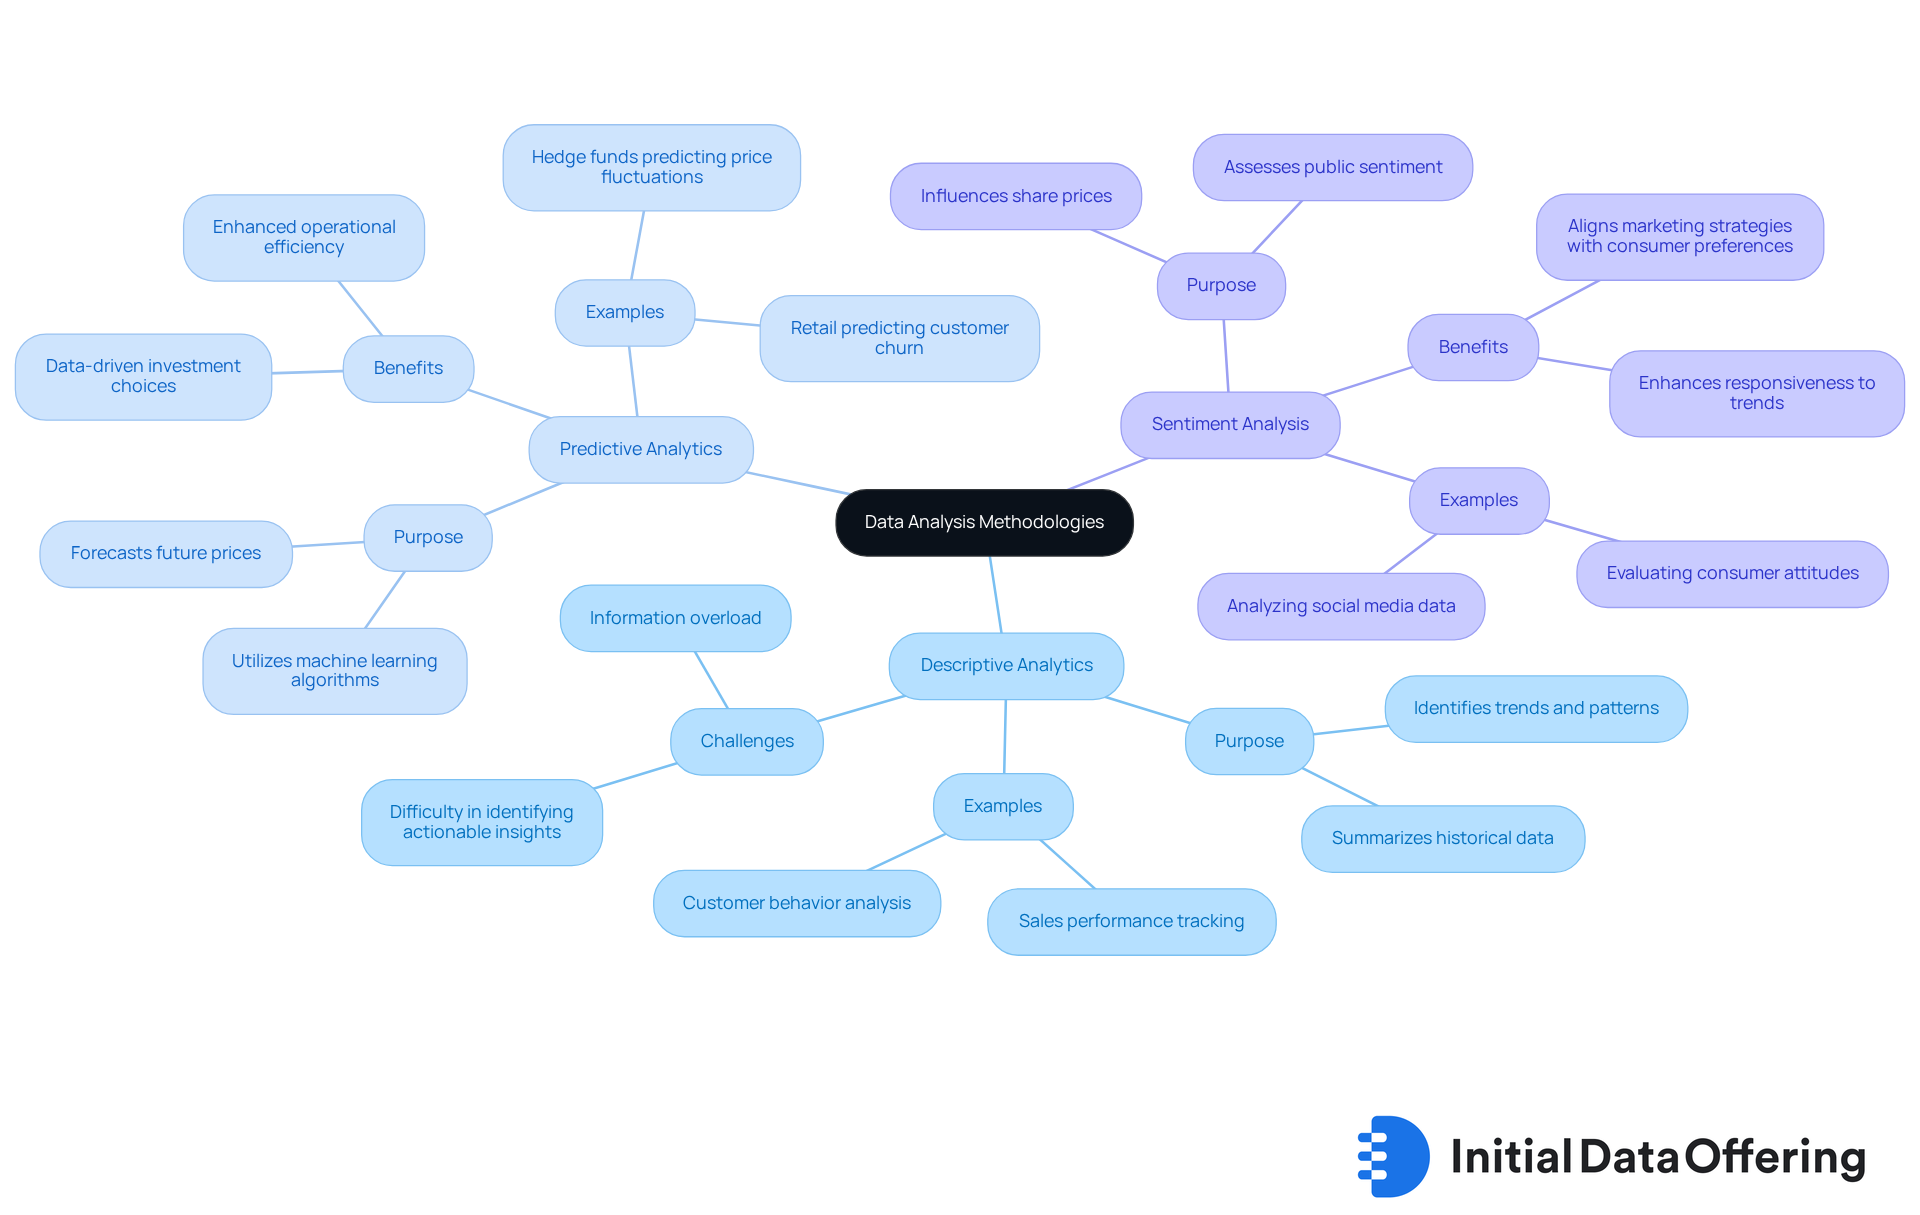
To analyze stock market data effectively, consider the following methodologies:
-
Descriptive Analytics: This approach utilizes statistical measures to summarize historical data, offering a clear view of past performance. For instance, descriptive analytics can uncover trends in share prices over time. This assists analysts in comprehending market behavior and recognizing patterns that guide future strategies. However, challenges such as information overload can complicate the identification of actionable insights.
-
Predictive Analytics: By utilizing machine learning algorithms, predictive analytics forecasts future prices based on historical trends and patterns. A notable statistic indicates that nearly 80% of marketers are now using data analytics to shape their strategies. This highlights the growing reliance on predictive models in financial forecasting. Hedge funds, for example, utilize these models to predict price fluctuations, facilitating data-driven investment choices that align with trends. According to a Deloitte study, companies using AI-driven analytics experienced a 30% boost in employee satisfaction. This underscores the significance of predictive analytics in enhancing operational efficiency.
-
Sentiment Analysis: This method entails examining news articles and social media to assess public sentiment, which can greatly impact share prices. Companies that effectively utilize sentiment analysis can better align their marketing strategies with consumer preferences, particularly in response to emerging trends. For example, sentiment analysis tools can evaluate shifting consumer attitudes across millions of information points. This assists companies in enhancing their marketing strategies.
Integrating these methodologies not only improves the precision of stock forecasts but also enables organizations to make knowledgeable choices based on data from a stock market database, fostering success in a competitive environment. Moreover, ensuring high information quality is essential for effective analytics, as clean information is crucial for deriving meaningful insights.

Leverage New Datasets for Market Insights
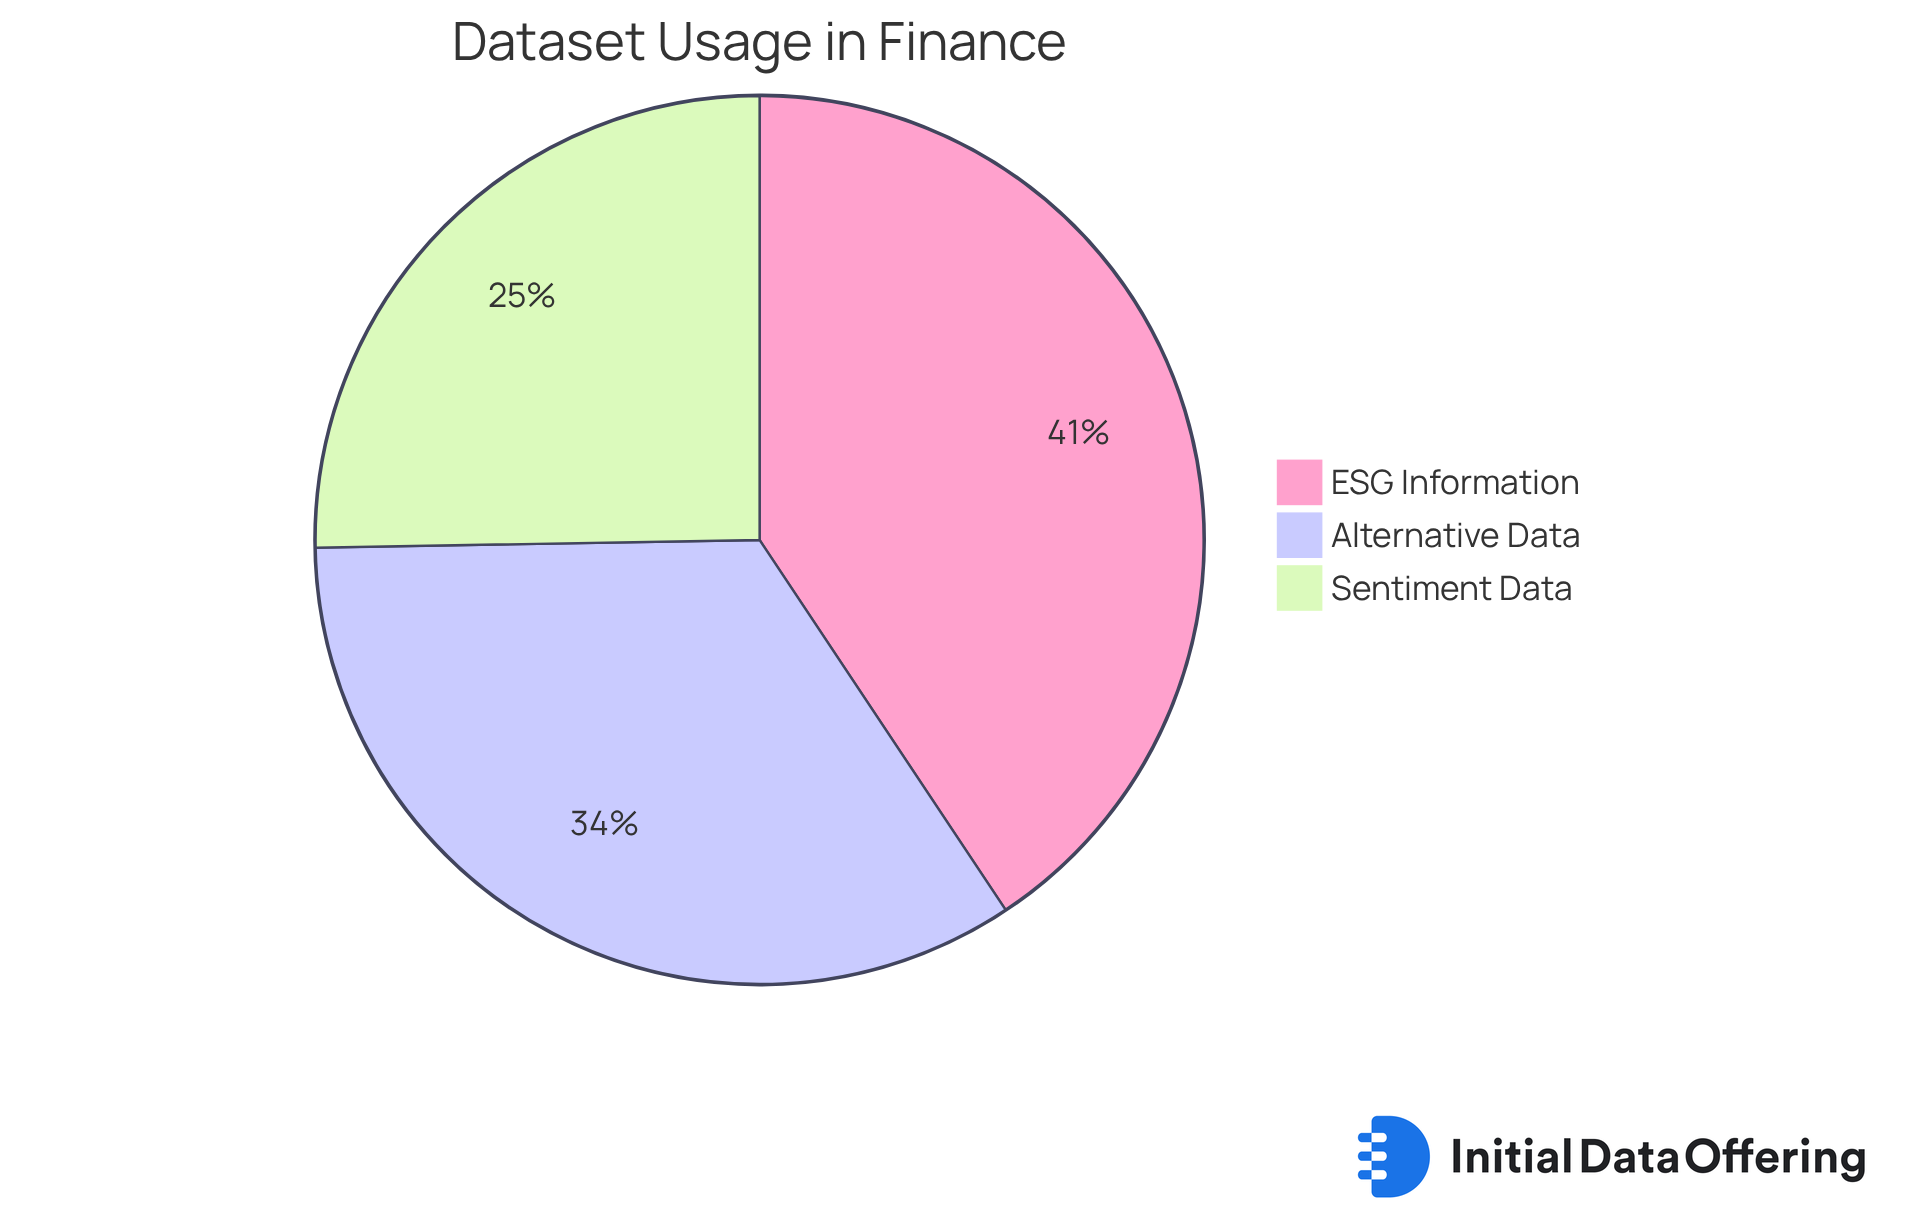
To gain a competitive edge, consider leveraging the following new datasets:
-
Alternative Data: Sources such as social media activity, satellite imagery, and web traffic provide critical insights into consumer behavior and market trends. This data enables financial institutions to enhance their risk profiling and credit decisions. For instance, 62% of financial institutions employ alternative information, illustrating its increasing significance in financial strategies. Furthermore, 70% of U.S. asset managers utilize satellite imagery and sentiment information to evaluate sustainability in their portfolios, emphasizing the incorporation of alternative resources in contemporary financial strategies.
-
ESG Information: Environmental, Social, and Governance (ESG) information is increasingly impacting financial decisions by highlighting companies that follow sustainable practices. In 2025, 74% of companies recognized the influence of ESG information on their funding decisions, indicating a notable shift towards sustainability in the financial sector. The worldwide alternative information sector is anticipated to expand at a compound annual growth rate of 63.4% from 2025 to 2030, underscoring the growing importance of ESG information in investment strategies.
-
Sentiment Data: Tools that assess public opinion regarding shares provide real-time insights into financial trends. Hedge funds, for instance, are utilizing sentiment analysis from social media to assess trends and modify portfolios promptly, with 46% emphasizing alternative data for targeted marketing campaigns.
A financial firm might examine social media sentiment to forecast share price movements. This approach enables them to capitalize on emerging trends before they become widespread. The integration of diverse datasets not only enhances decision-making but also aligns with the current trend of using data-driven insights to navigate the complexities of the stock market database. Furthermore, the increasing reliance on ESG data is becoming a critical factor in investment strategies, leading to more informed and sustainable investment choices.

Conclusion
Mastering stock market database strategies is crucial for achieving accurate insights and making informed investment decisions. By understanding the underlying structures of these databases, analysts can effectively navigate the complexities of financial data, enhancing their analytical capabilities and leading to more strategic outcomes.
The article highlights key components such as:
- Ticker symbols
- OHLCV information
- Financial statements
These elements are essential for thorough market analysis. They not only provide a foundation for understanding market dynamics but also enhance the reliability of the analysis. Furthermore, the importance of data accuracy and reliability is underscored through practices like:
- Data validation
- Automated cleansing
- Regular audits
Effective methodologies such as:
- Descriptive analysis
- Predictive analysis
- Sentiment analysis
are discussed, showcasing their roles in deriving actionable insights from stock market data. The integration of new datasets, including alternative and ESG information, enriches the analytical landscape, enabling firms to adapt to evolving market trends.
In summary, embracing these best practices and methodologies is essential for any analyst looking to thrive in the competitive stock market environment. By leveraging accurate data and innovative analytical techniques, professionals can enhance their decision-making processes and contribute to more sustainable investment strategies. The future of stock market analysis lies in the ability to harness diverse data sources and methodologies, ensuring that informed decisions are made in an increasingly complex financial landscape.
Frequently Asked Questions
What are the common database structures used in stock market analysis?
Common database structures include relational databases, which organize information into tables, and time-series databases, which are optimized for managing data indexed by time.
Why is it important to understand stock market database structures?
Understanding these frameworks is essential for analysts as they provide the basis for accurate data interpretation and analysis, enhancing analytical capabilities and informed decision-making.
What are ticker symbols in stock market databases?
Ticker symbols are unique identifiers for each stock, essential for tracking performance and allowing analysts to quickly access and compare stock data.
What does OHLCV information stand for, and why is it important?
OHLCV stands for Open, High, Low, Close, and Volume metrics. This information provides a thorough perspective on market performance over time and offers valuable insights into market trends and investor behavior.
What types of financial statements are included in stock market databases?
Stock market databases typically include income statements, balance sheets, and cash flow statements, which are crucial for conducting fundamental analysis and assessing the financial health of companies.
How can familiarity with stock market database structures benefit analysts?
Familiarity with these structures helps analysts navigate the information landscape better, leading to improved interpretation of complex financial data and more strategic insights.