9 Essential Advertising Data Metrics Every Analyst Should Know

9 Essential Advertising Data Metrics Every Analyst Should Know
Overview
The article highlights essential advertising data metrics that analysts must understand to effectively evaluate advertising performance. Metrics such as:
- Customer Acquisition Cost
- Return on Ad Spend
- Click-Through Rate
are not just numbers; they are pivotal features that provide insights into cost-effectiveness, profitability, and audience engagement. Understanding these metrics offers significant advantages, allowing marketers to optimize their strategies and achieve better campaign outcomes. By analyzing these metrics, analysts gain the ability to make informed decisions that enhance marketing effectiveness. Ultimately, mastering these metrics equips professionals with the knowledge to drive successful advertising campaigns.
How can these insights transform your approach to marketing? Consider the implications of these metrics in your current strategies and the potential for improved results.
Introduction
Understanding the intricacies of advertising data metrics is crucial for analysts navigating the ever-evolving landscape of digital marketing. With a plethora of metrics available, each offering unique insights into campaign performance, it becomes essential to identify which indicators can drive effective decision-making and optimize advertising strategies.
How can organizations ensure they are leveraging the right metrics to not only measure success but also enhance their overall advertising effectiveness?
This article delves into nine essential advertising data metrics that every analyst should know, providing the tools needed to elevate marketing efforts and achieve significant outcomes.
Initial Data Offering: Access Comprehensive Advertising Data Metrics
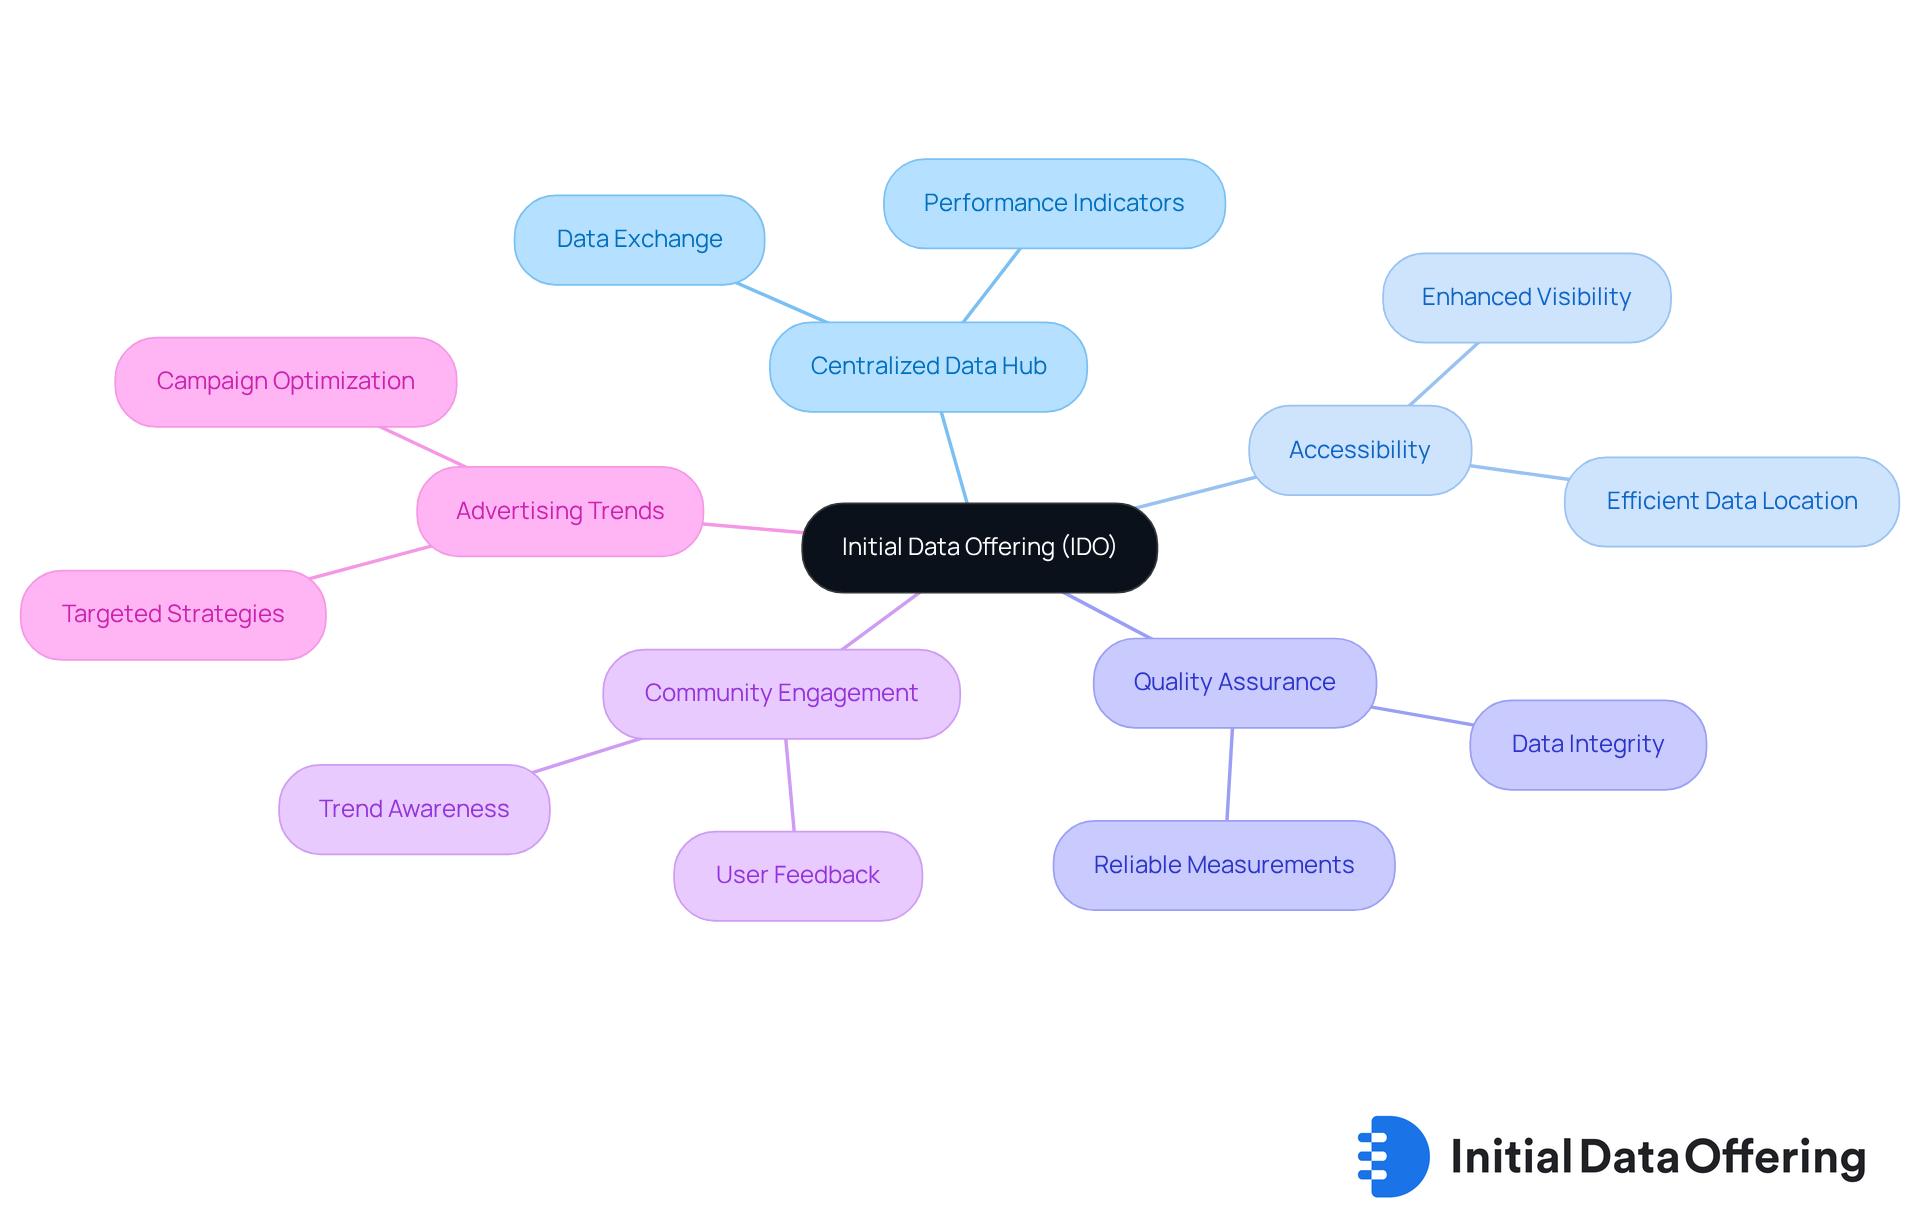
The Initial Data Offering (IDO) serves as a pivotal platform that simplifies the launch and exploration of new datasets, particularly in the realm of advertising data measurements. By functioning as a centralized hub for data exchange, IDO enhances the accessibility and visibility of essential data resources. This improvement allows analysts to efficiently locate the indicators necessary for evaluating advertising data performance.
Furthermore, IDO's commitment to quality and community engagement ensures that users remain informed about the latest advertising data trends and insights, which are crucial for making well-informed decisions regarding advertising strategies. As the advertising landscape evolves, the importance of reliable advertising data measurements becomes increasingly clear; they empower analysts to refine campaigns and achieve significant outcomes.
How can your organization leverage these insights to enhance its advertising efforts?
Customer Acquisition Cost: Measure the Cost of Gaining New Customers
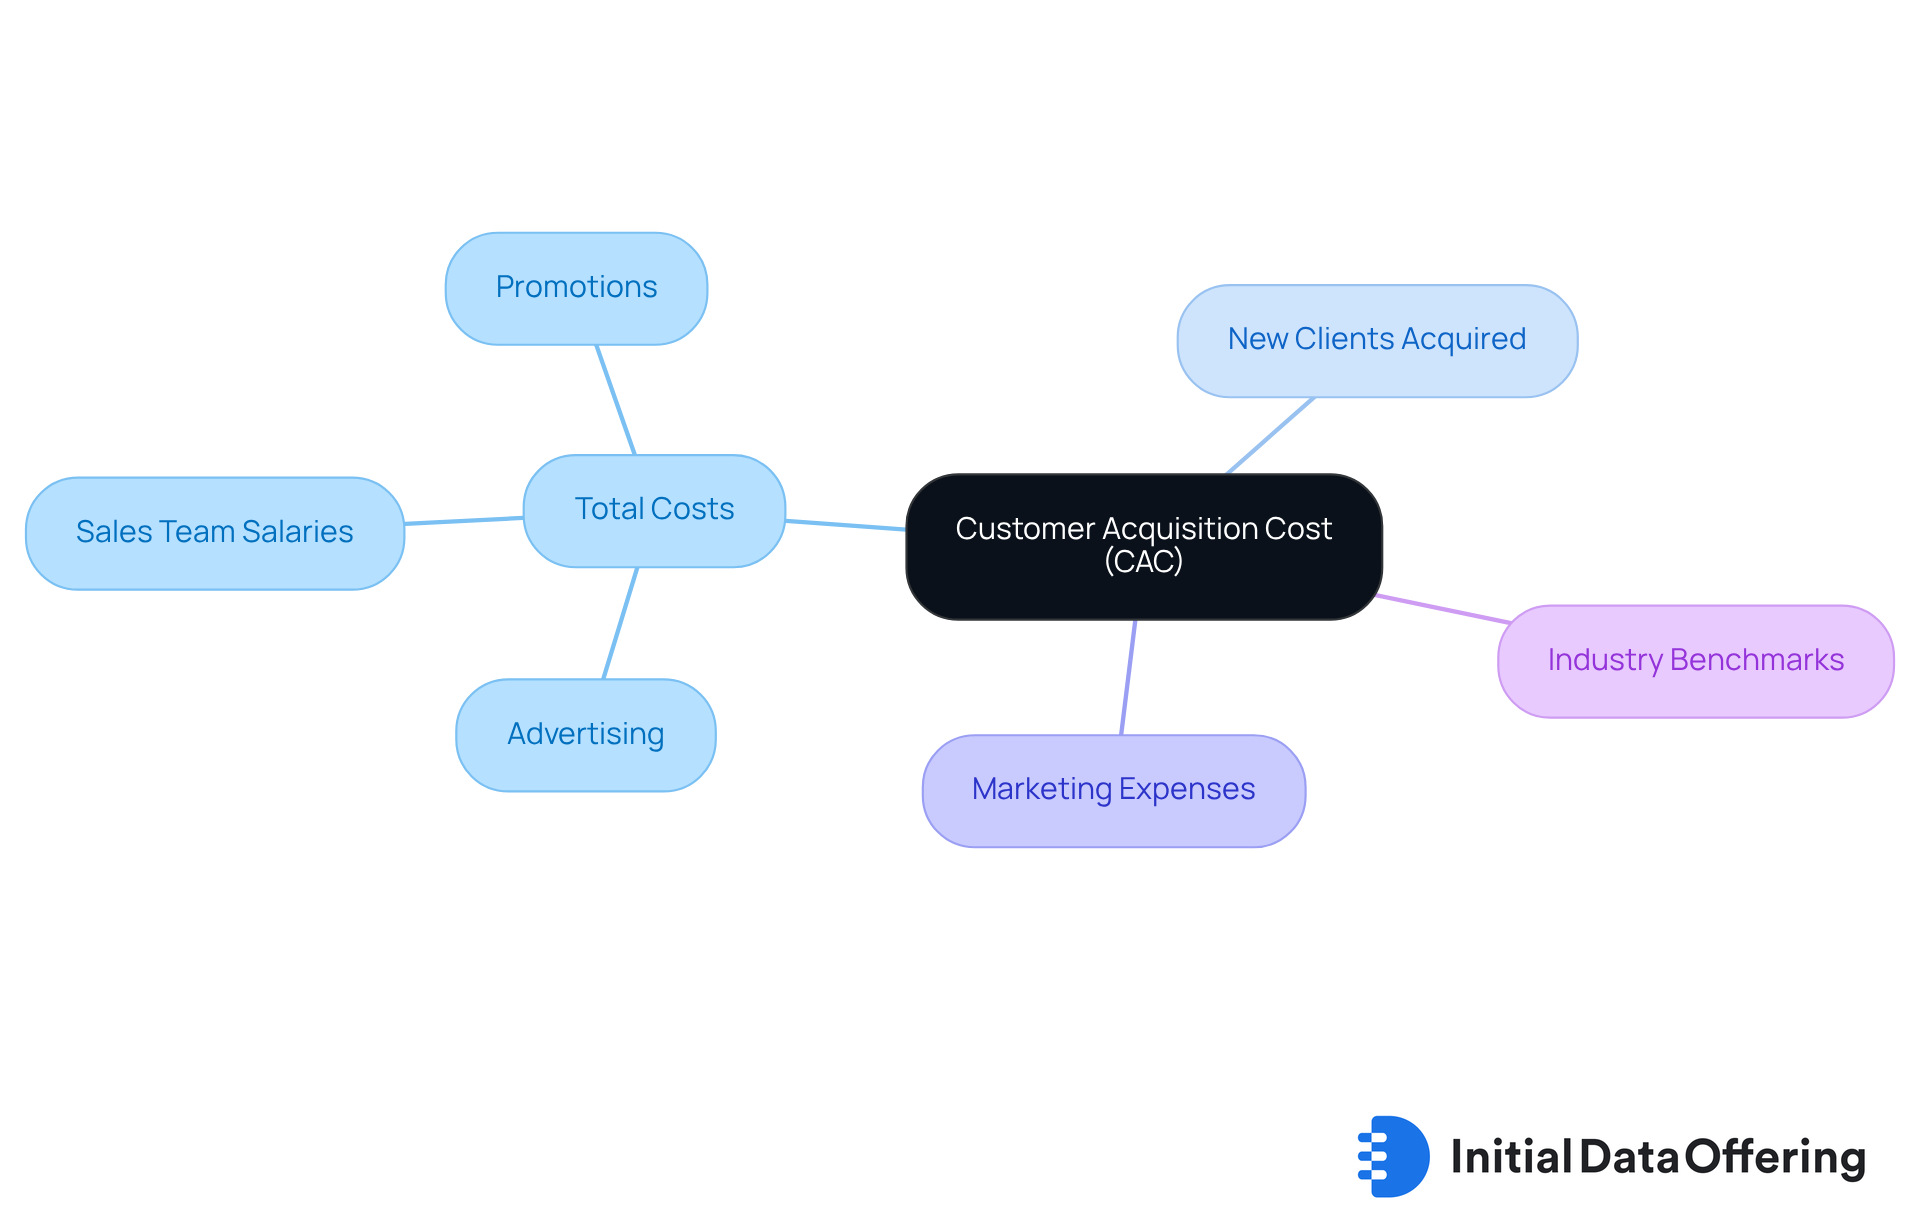
Customer Acquisition Cost (CAC) serves as a crucial metric that evaluates the total expense involved in acquiring a new client through marketing and sales efforts. To determine CAC, one must divide the total costs associated with client acquisition, which include marketing expenses, by the number of new clients acquired over a defined period. A lower CAC signifies a more effective marketing strategy, enabling businesses to allocate resources wisely and maximize their return on investment (ROI).
Therefore, it is essential for analysts to consistently monitor CAC to ensure that their customer acquisition strategies remain cost-effective.
How does your current CAC compare to industry benchmarks? Understanding this can provide valuable insights into the efficiency of your marketing initiatives.
Return on Ad Spend: Evaluate the Profitability of Your Campaigns
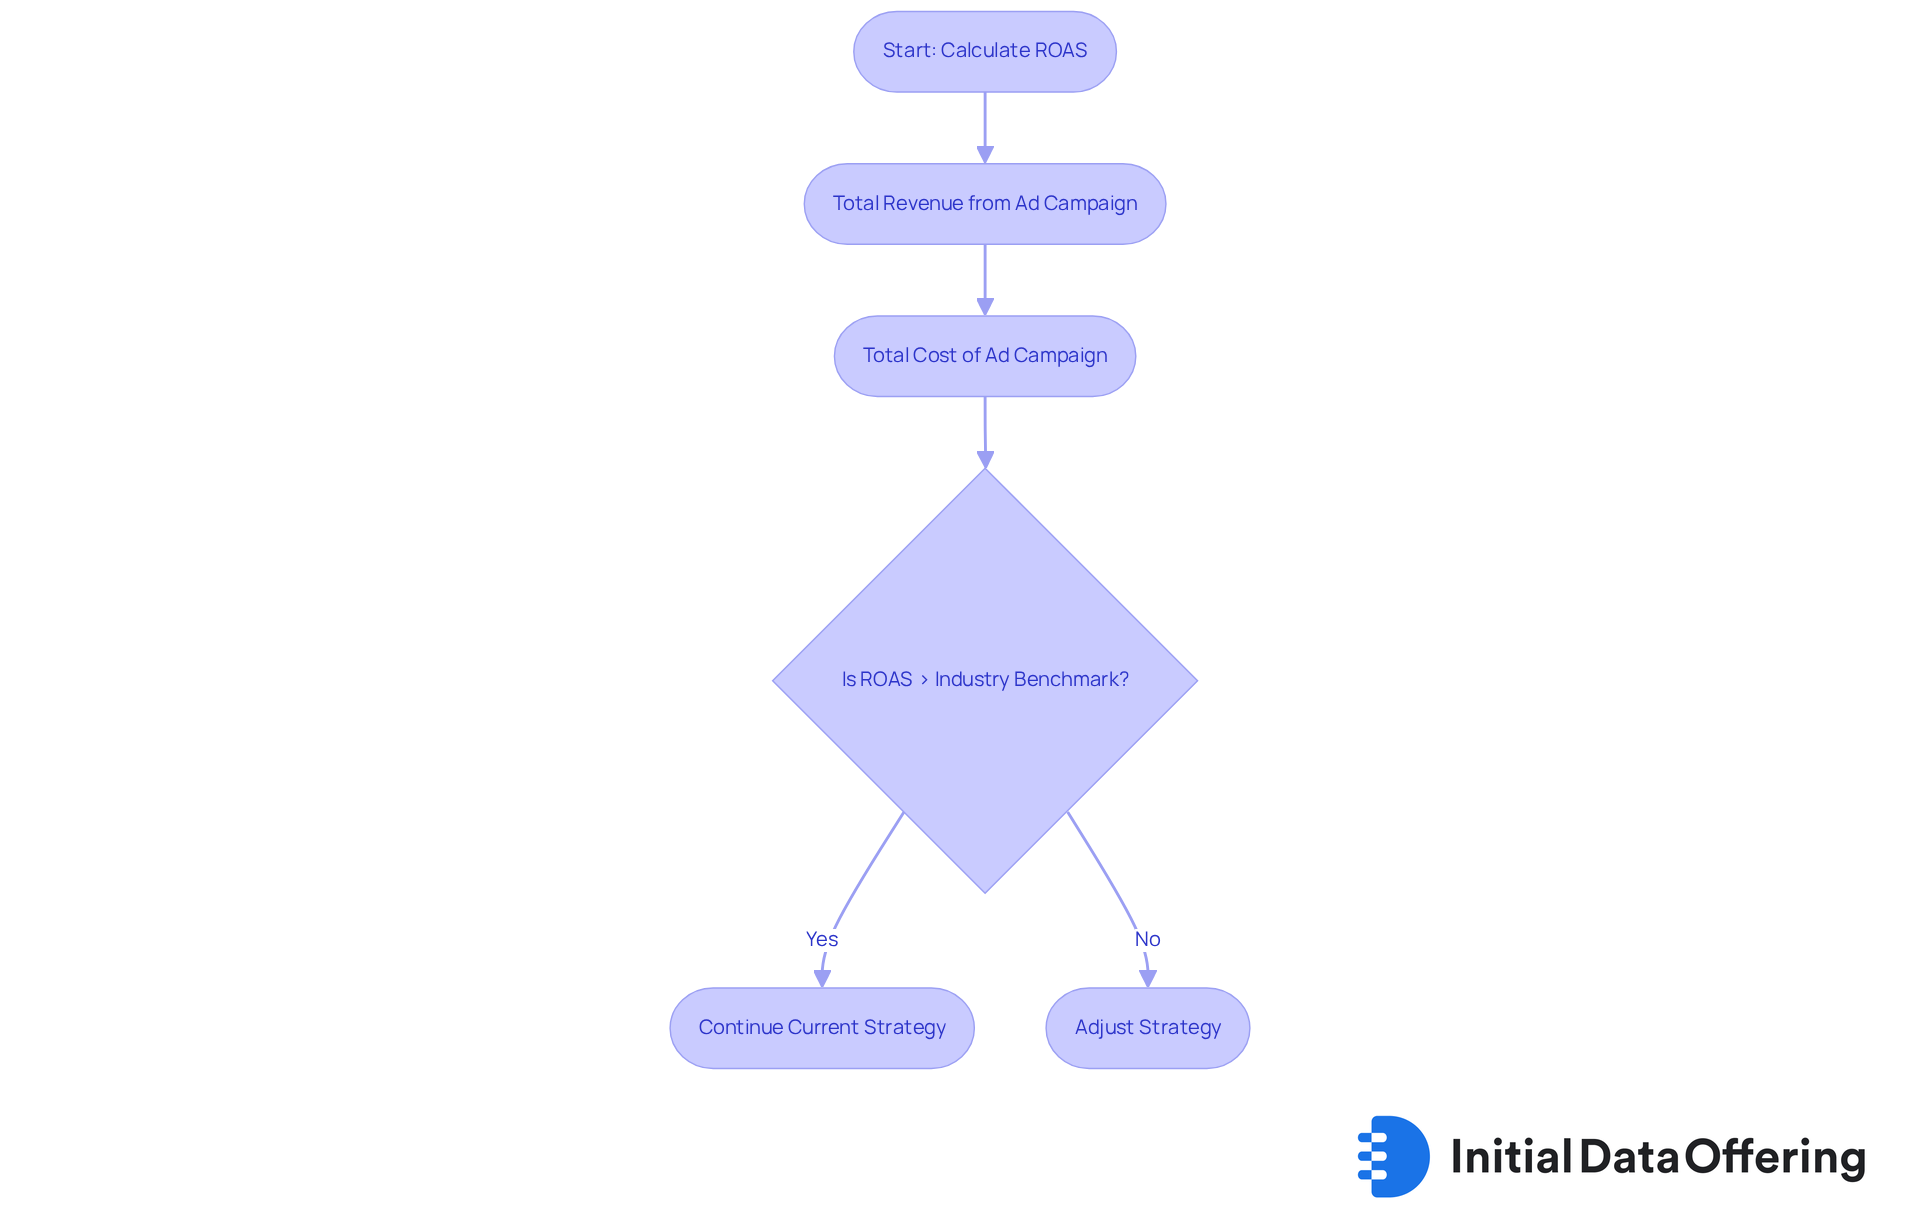
Return on Ad Spend (ROAS) serves as a crucial performance indicator, quantifying the revenue generated for every dollar invested in advertising. By dividing the total revenue from an ad campaign by the total cost of that campaign, analysts can calculate ROAS effectively. A higher ROAS signifies a more profitable campaign, while a lower ROAS may indicate the necessity for strategic adjustments.
Why is this important? Analysts should strive for a ROAS that surpasses industry benchmarks, ensuring that their advertising efforts yield satisfactory returns. This not only enhances profitability but also optimizes resource allocation in future campaigns.
Click-Through Rate: Assess the Effectiveness of Your Ad Creatives
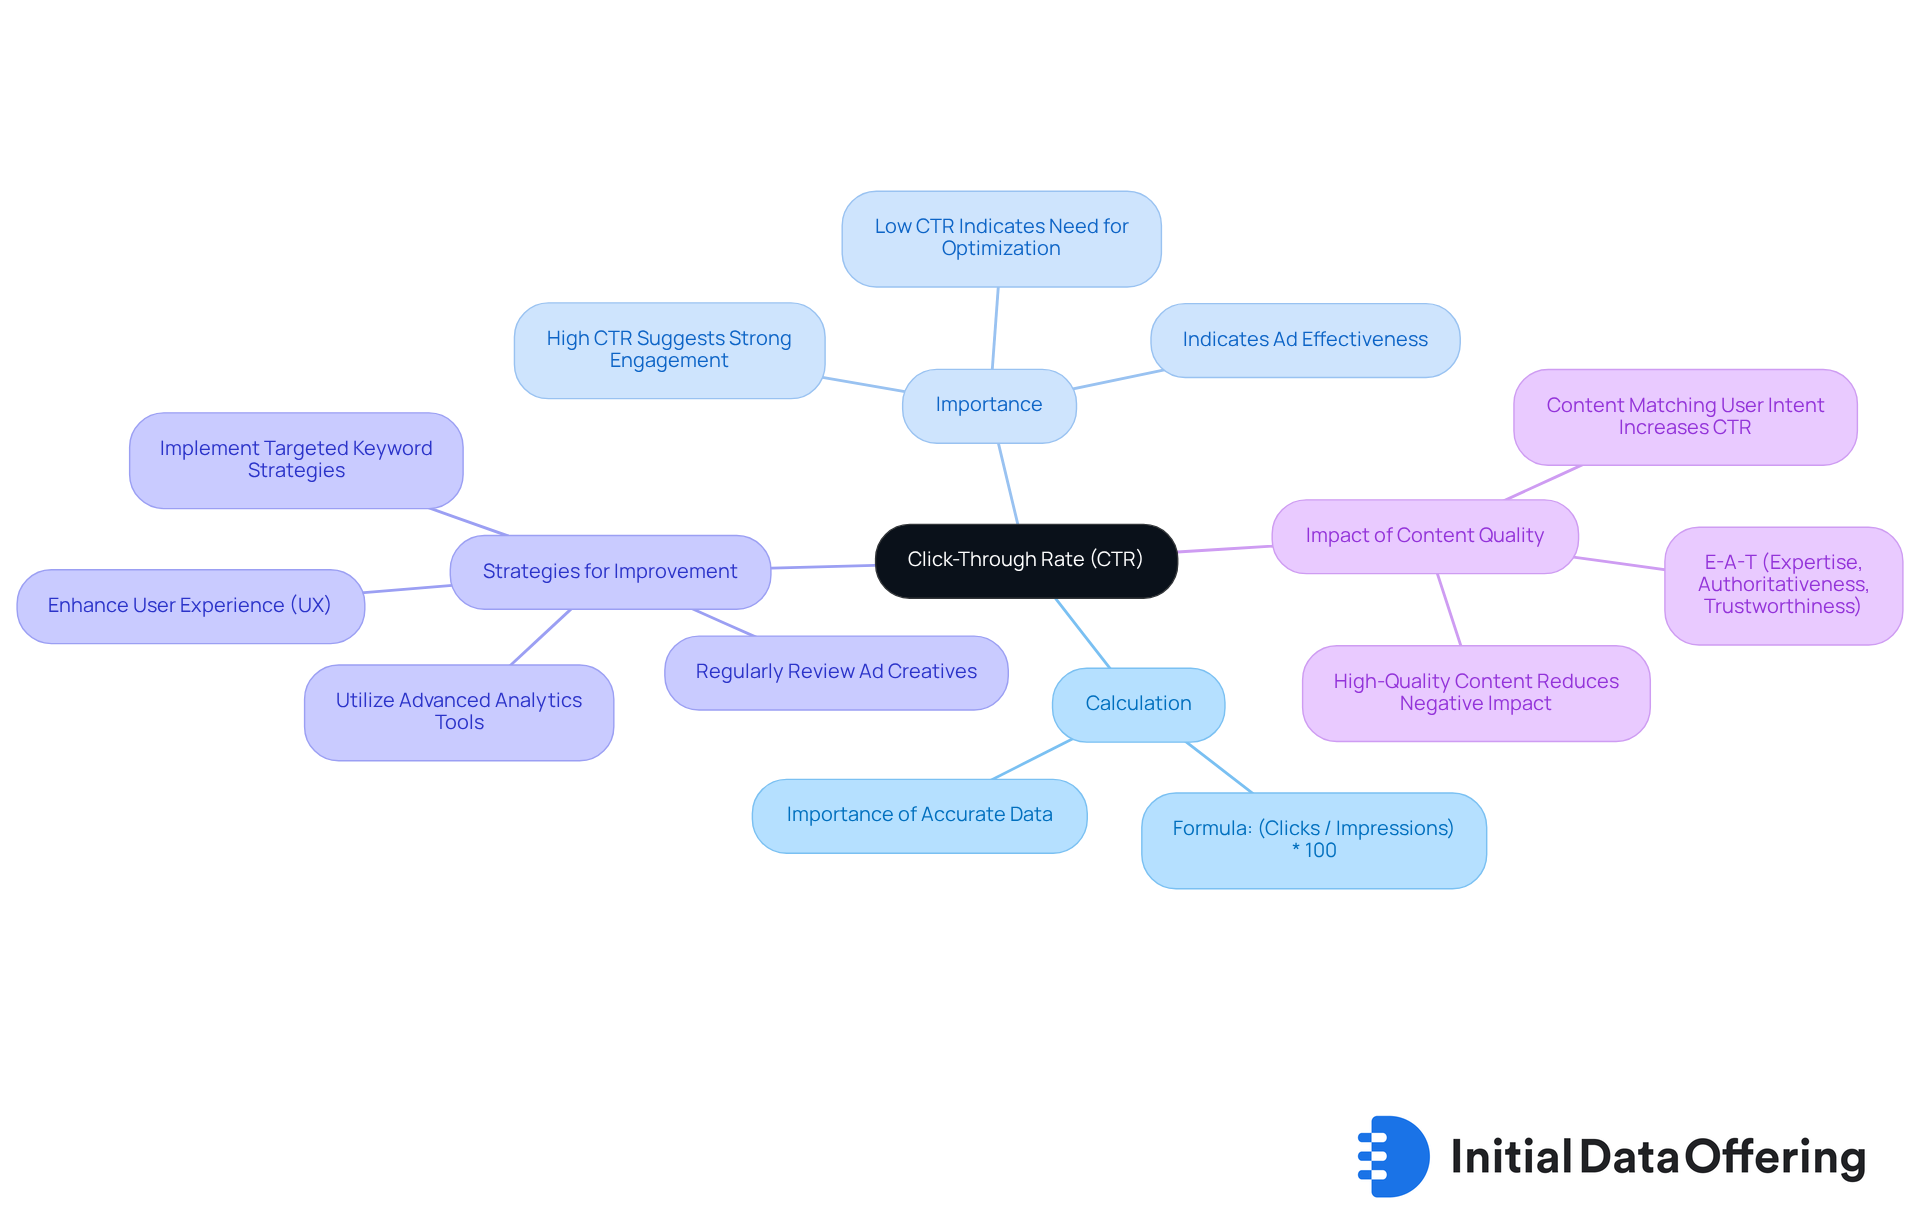
Click-Through Rate (CTR) is a critical metric that quantifies the effectiveness of digital advertising by measuring the percentage of users who click on an ad after viewing it. To calculate CTR, divide the number of clicks by the number of impressions and multiply by 100. A greater CTR indicates that the ad connects effectively with the target audience, suggesting strong interaction and relevance. Conversely, a low CTR may highlight the need for optimization in ad creatives.
Recent analyses have shown that pages featuring high-quality, informative content experience less negative impact on CTRs, even following significant algorithm updates. This underscores the importance of creating valuable content that aligns with user intent. For instance, ads that effectively match search intent can achieve up to a 20% higher CTR compared to those that do not.
To enhance CTR, analysts should adopt several strategies:
- Regularly review and refine ad creatives based on performance data.
- Focus on user experience (UX) by ensuring ads lead to fast-loading, intuitive landing pages.
- Utilize advanced analytics tools to identify high-performing content and areas needing improvement.
- Implement targeted keyword strategies that reflect user search behavior and intent.
As noted by a leading SEO authority, "The 2024 update has rewritten the rulebook for CTRs; it’s no longer just about being on the first page—it’s about being the most relevant and engaging result on that page." Understanding and optimizing CTR using advertising data is essential for maximizing ad effectiveness and ensuring that campaigns achieve their desired outcomes. As the digital environment changes, keeping a sharp focus on CTR will enable analysts to enhance engagement and conversion outcomes.
Conversion Rate: Measure the Success of Your Advertising Efforts
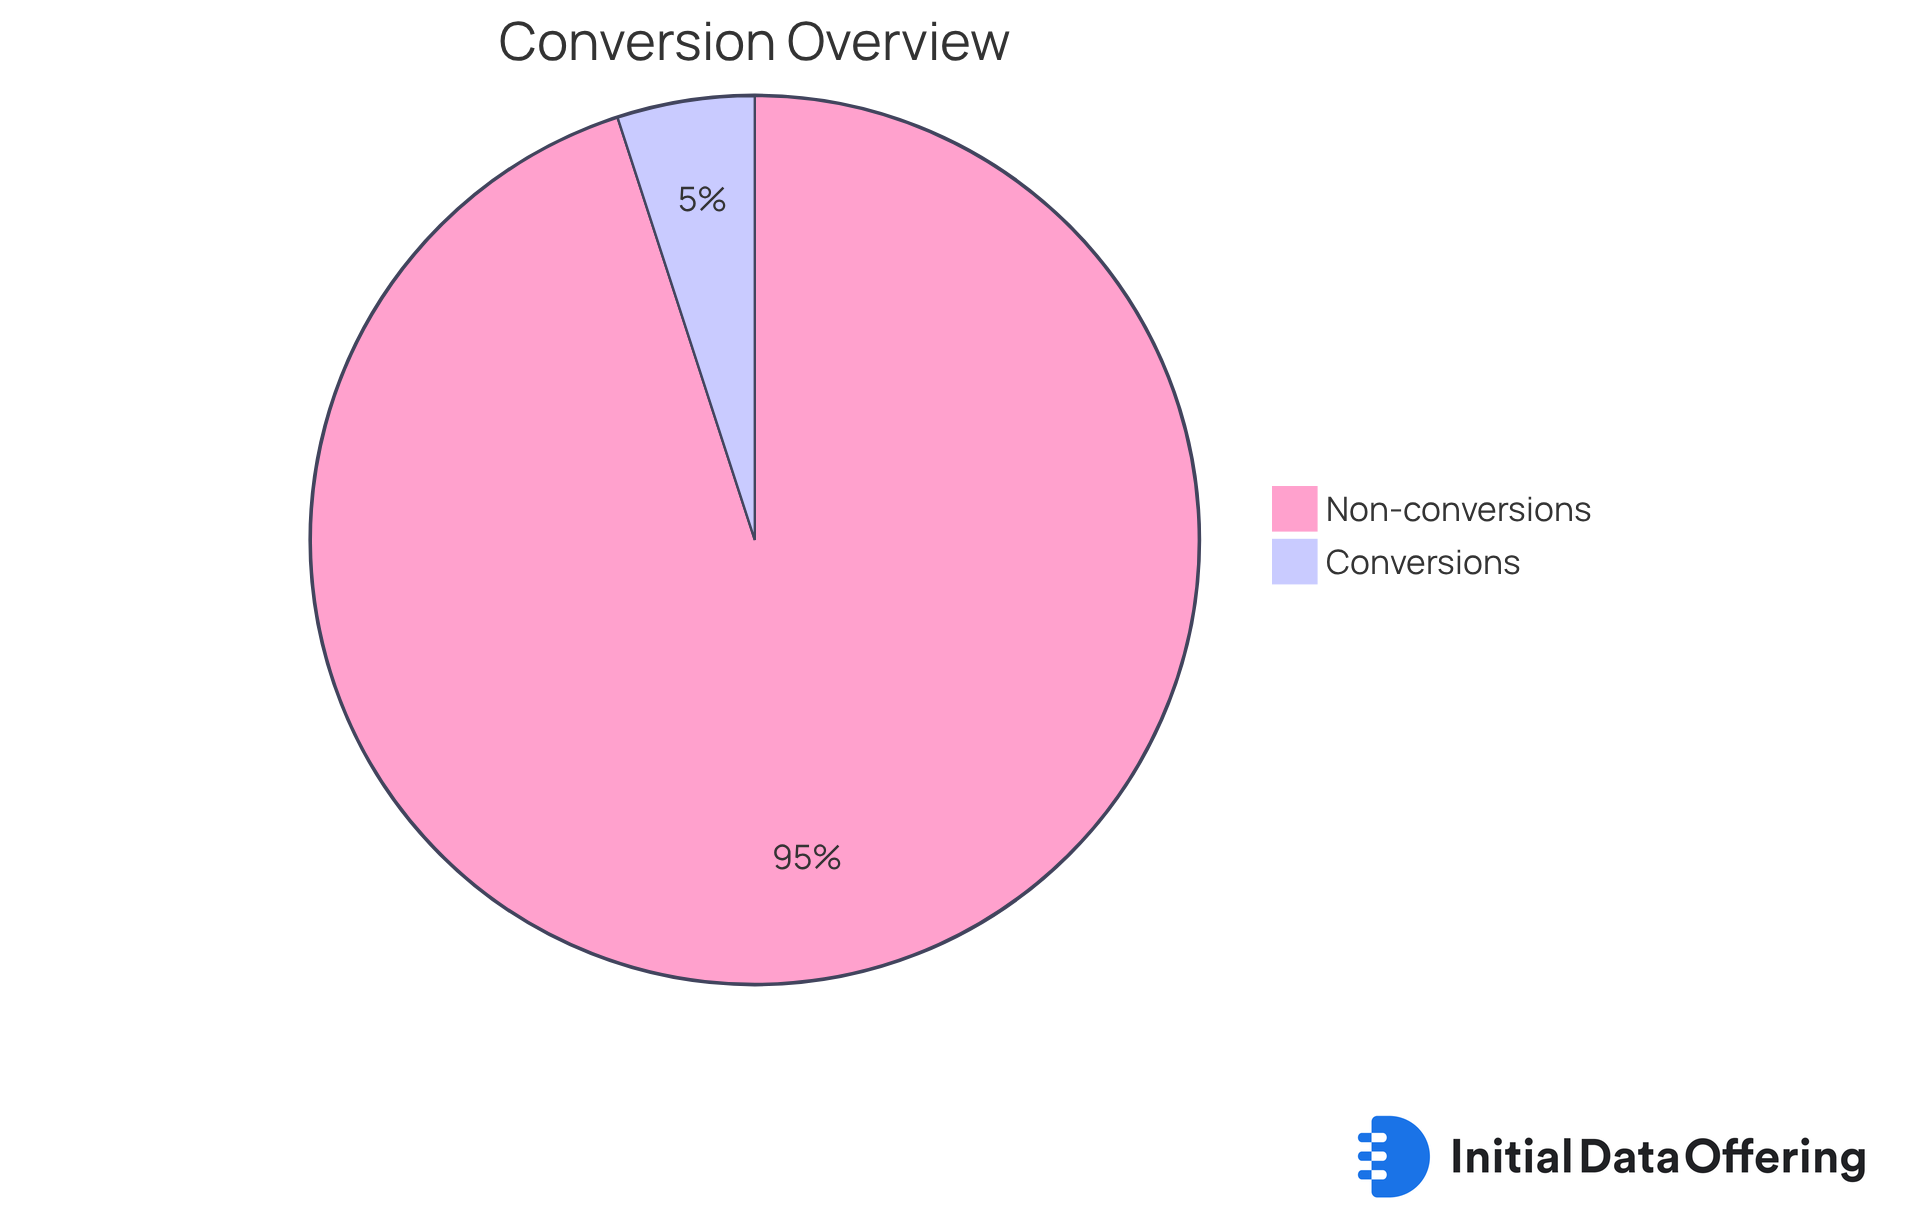
Conversion Rate serves as a crucial metric, representing the percentage of users who complete a desired action after engaging with an advertisement. To calculate the conversion ratio, one must divide the number of conversions by the total number of visitors and then multiply the result by 100.
Why is this significant? An increased conversion level suggests that advertising data indicates successful motivation of user actions, such as purchases or sign-ups. Therefore, analysts should prioritize optimizing landing pages and enhancing user experiences. This focus not only improves conversion rates but also maximizes the overall effectiveness of marketing campaigns.
Customer Lifetime Value: Understand the Long-Term Value of Customers
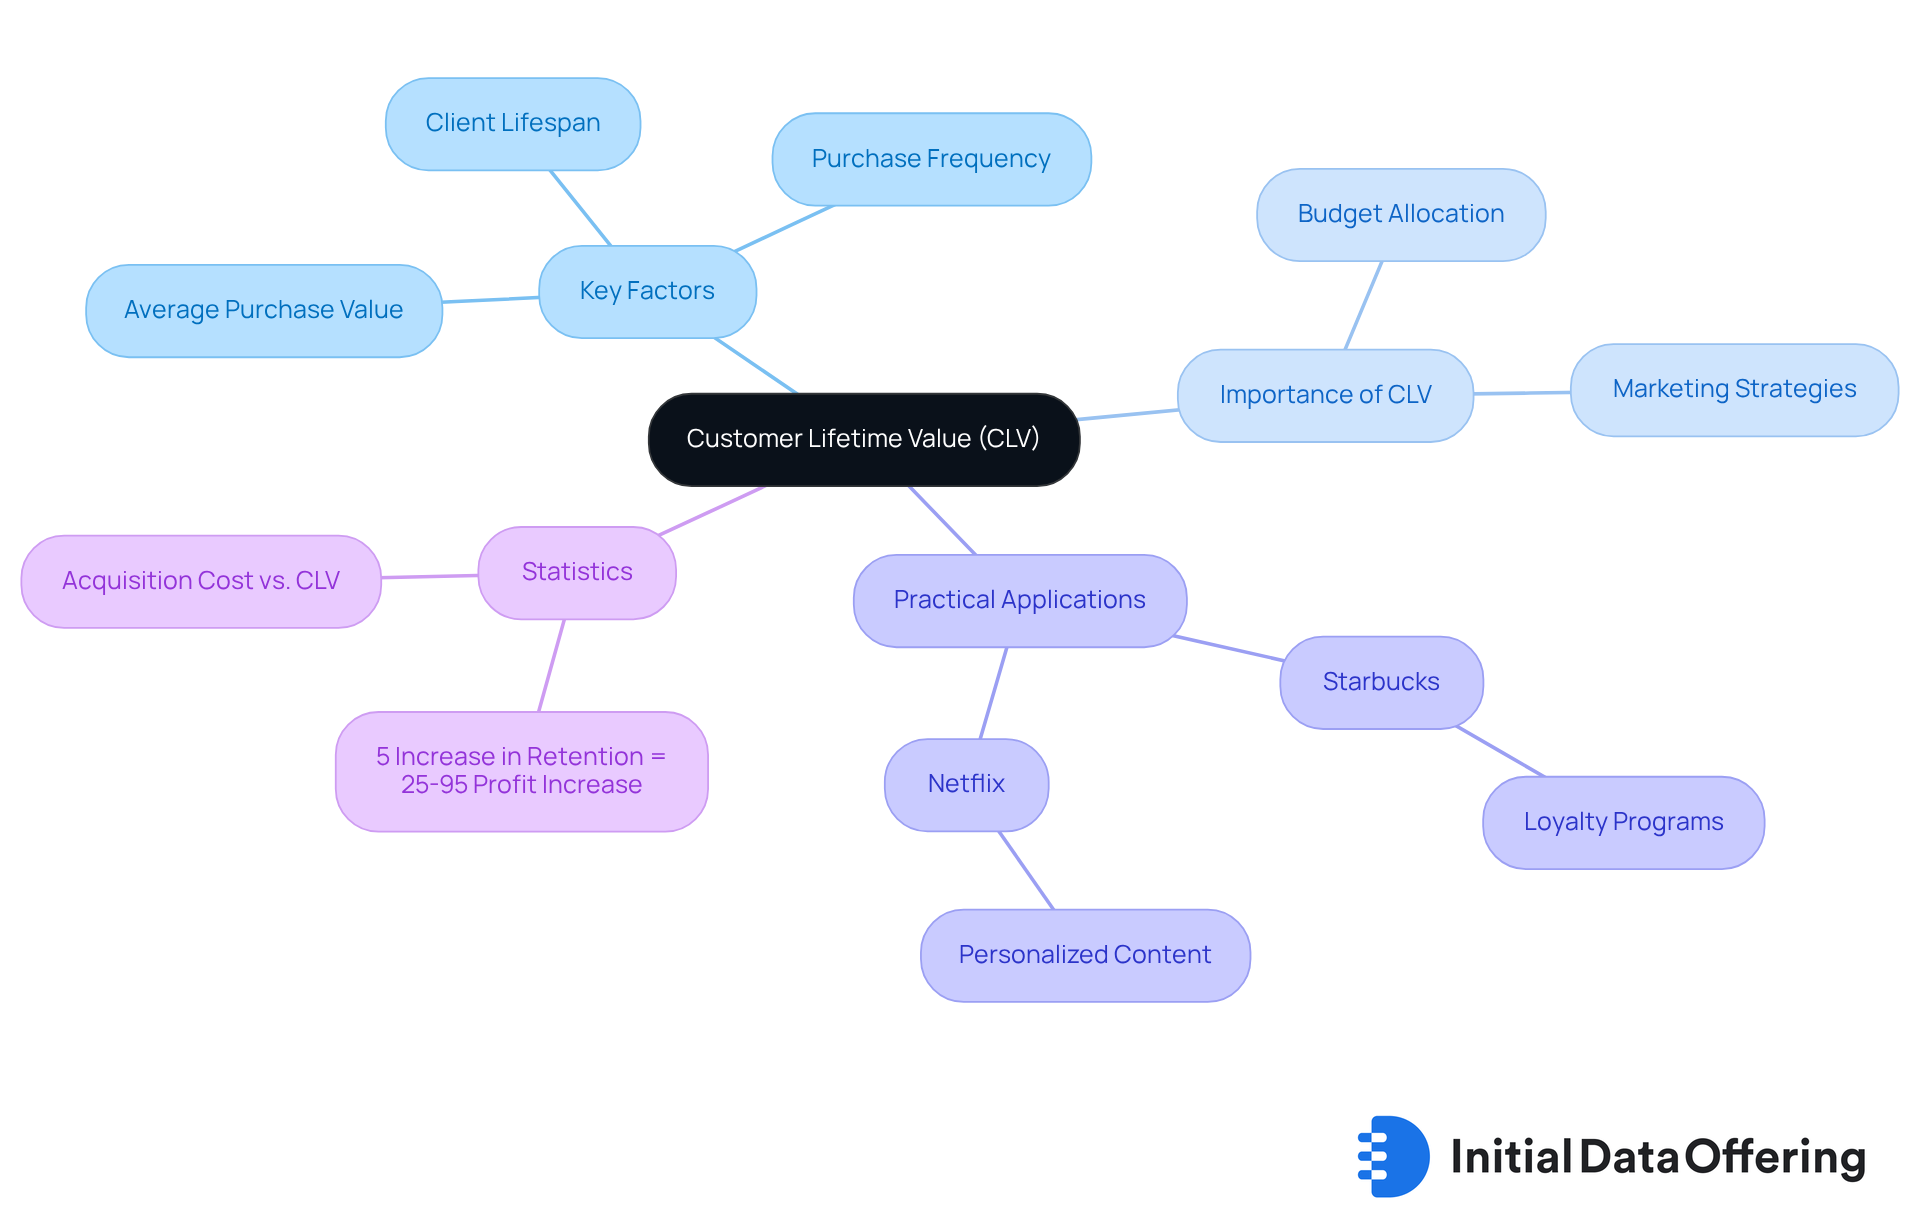
Customer Lifetime Value (CLV) quantifies the total revenue a business can anticipate from an individual over the duration of their relationship. This metric is essential for identifying high-value clients and tailoring marketing strategies using advertising data to enhance engagement and retention. To effectively calculate CLV, analysts should consider key factors such as:
- Average purchase value
- Purchase frequency
- Client lifespan
For instance, if an individual spends an average of $100 per year and remains loyal for 10 years, their CLV would be $1,000.
Understanding CLV enables companies to allocate budgets more efficiently for acquiring and retaining clients. A well-calculated CLV can inform investment choices, ensuring that marketing efforts focus on the most lucrative segments. For example, firms like Starbucks and Netflix utilize CLV data to customize marketing strategies, including targeted offers and content suggestions, thereby enhancing loyalty and lifetime value.
Statistics indicate that enhancing client retention by merely 5% can result in a profit rise of 25% to 95%, as stated by Bain & Co. This emphasizes the importance of concentrating on current clients, as it costs six to seven times more to acquire a new client than to retain an existing one. By analyzing CLV alongside advertising data, businesses can optimize their marketing strategies, ensuring that acquisition costs do not exceed the lifetime value of clients. Ideally, maintaining a 3:1 ratio of CLV to Acquisition Cost (CAC) is crucial. Furthermore, it is essential for businesses to regularly reassess their CLV calculations to adapt to changes in customer behavior and market conditions.
Ultimately, mastering CLV allows businesses to make informed decisions that drive sustainable growth and profitability. How can your organization leverage CLV to enhance client relationships and improve marketing effectiveness?
Impressions: Gauge the Visibility of Your Advertising Campaigns
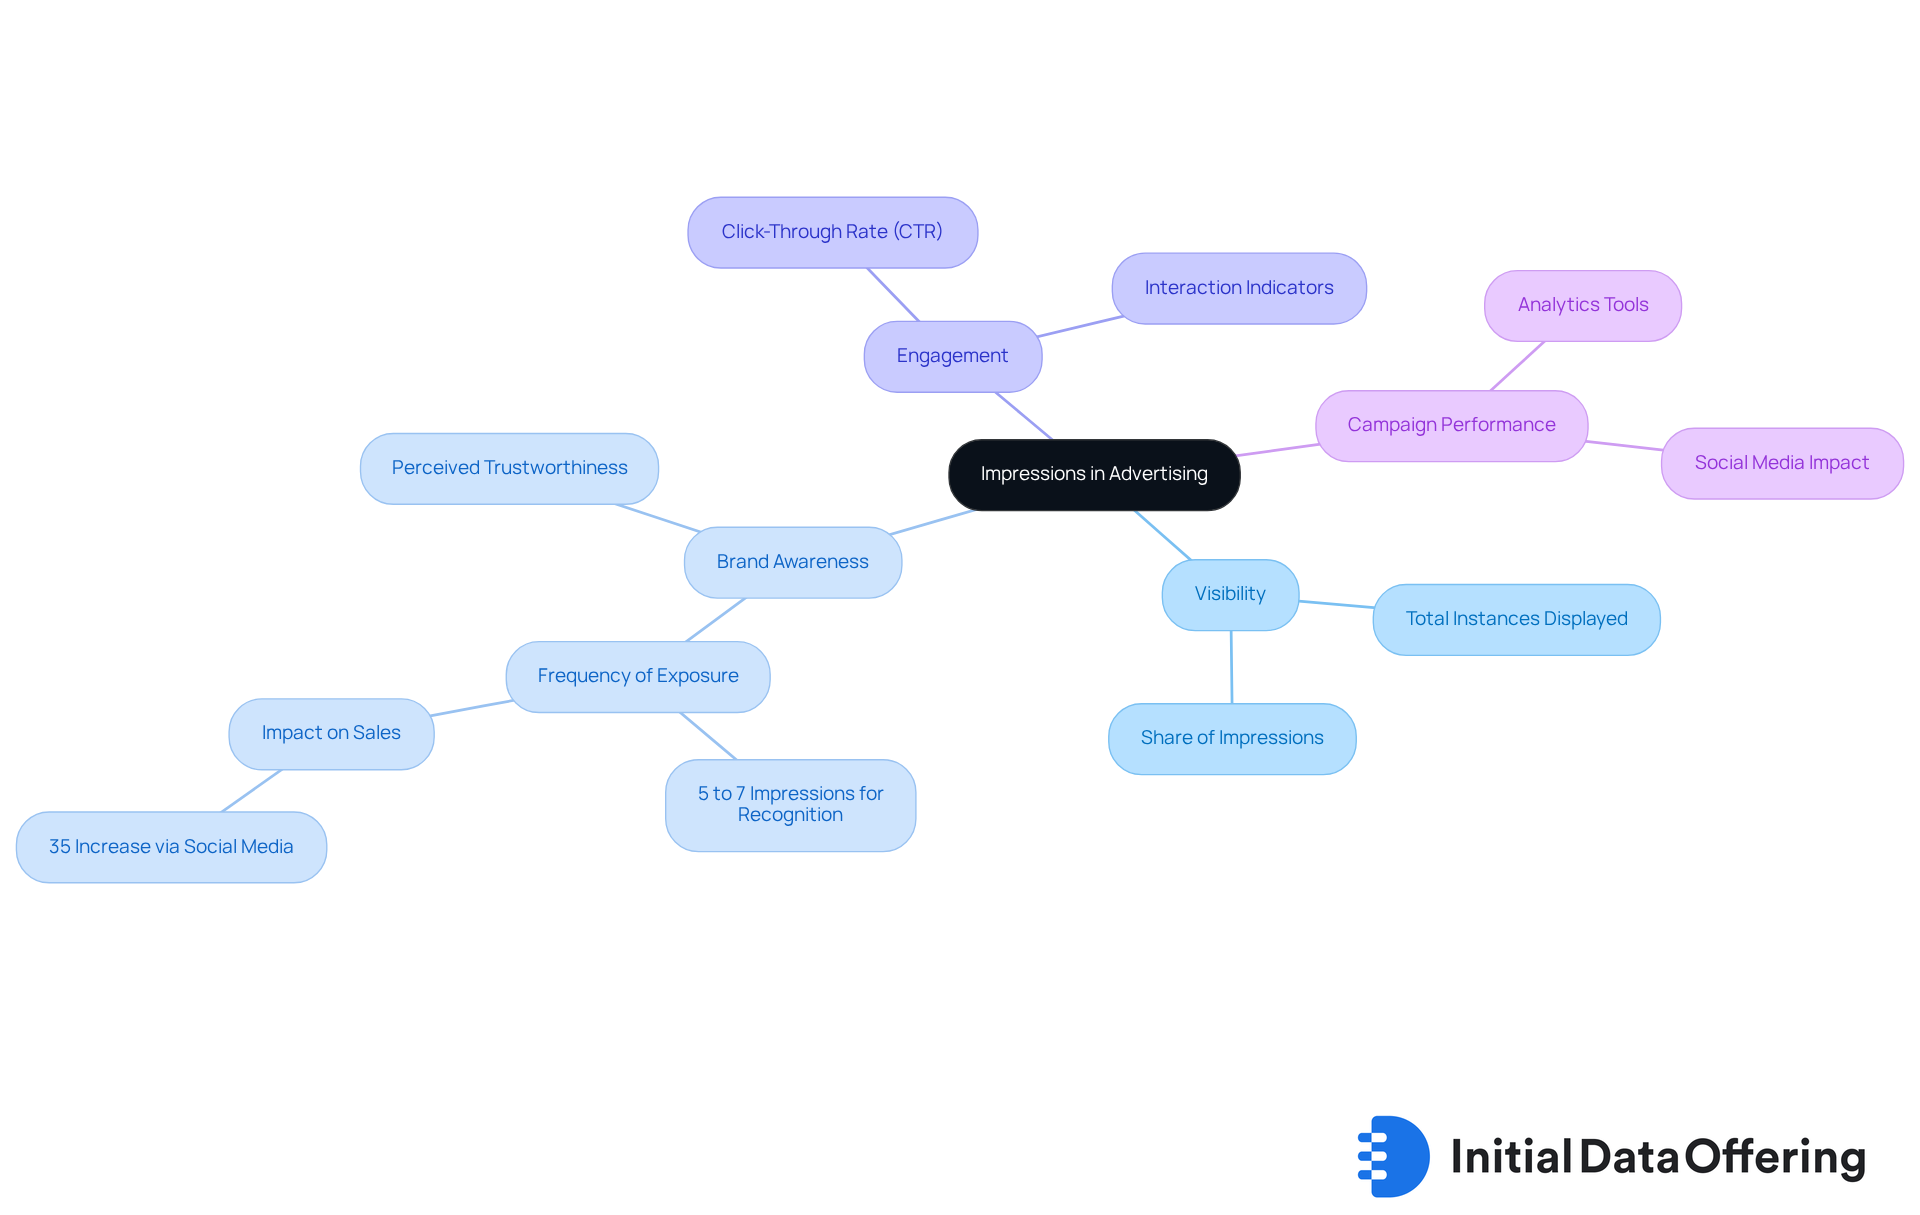
Impressions represent the total instances an ad is displayed to users, regardless of clicks. This metric is essential for assessing the visibility of advertising campaigns. Research shows that it typically takes five to seven impressions for consumers to begin recognizing a brand, emphasizing the necessity of frequent exposure for building brand awareness. Marketers can effectively monitor impressions through analytics tools that provide insights into advertising data and ad visibility across various platforms, facilitating a comprehensive understanding of campaign performance.
A higher count of impressions is often linked to improved brand awareness. However, it is crucial to balance this metric with interaction indicators to ensure that visibility translates into meaningful interactions. As industry experts note, concentrating solely on impressions without factoring in engagement can result in missed opportunities for deeper consumer connections. Successful campaigns, particularly those leveraging social media platforms, demonstrate that substantial impression figures can significantly enhance brand visibility and boost conversions. For example, brands that effectively harness social media can experience a 35% increase in sales, underscoring the potential impact of strategic impression management on overall marketing success.
Engagement Rate: Measure Audience Interaction with Your Ads
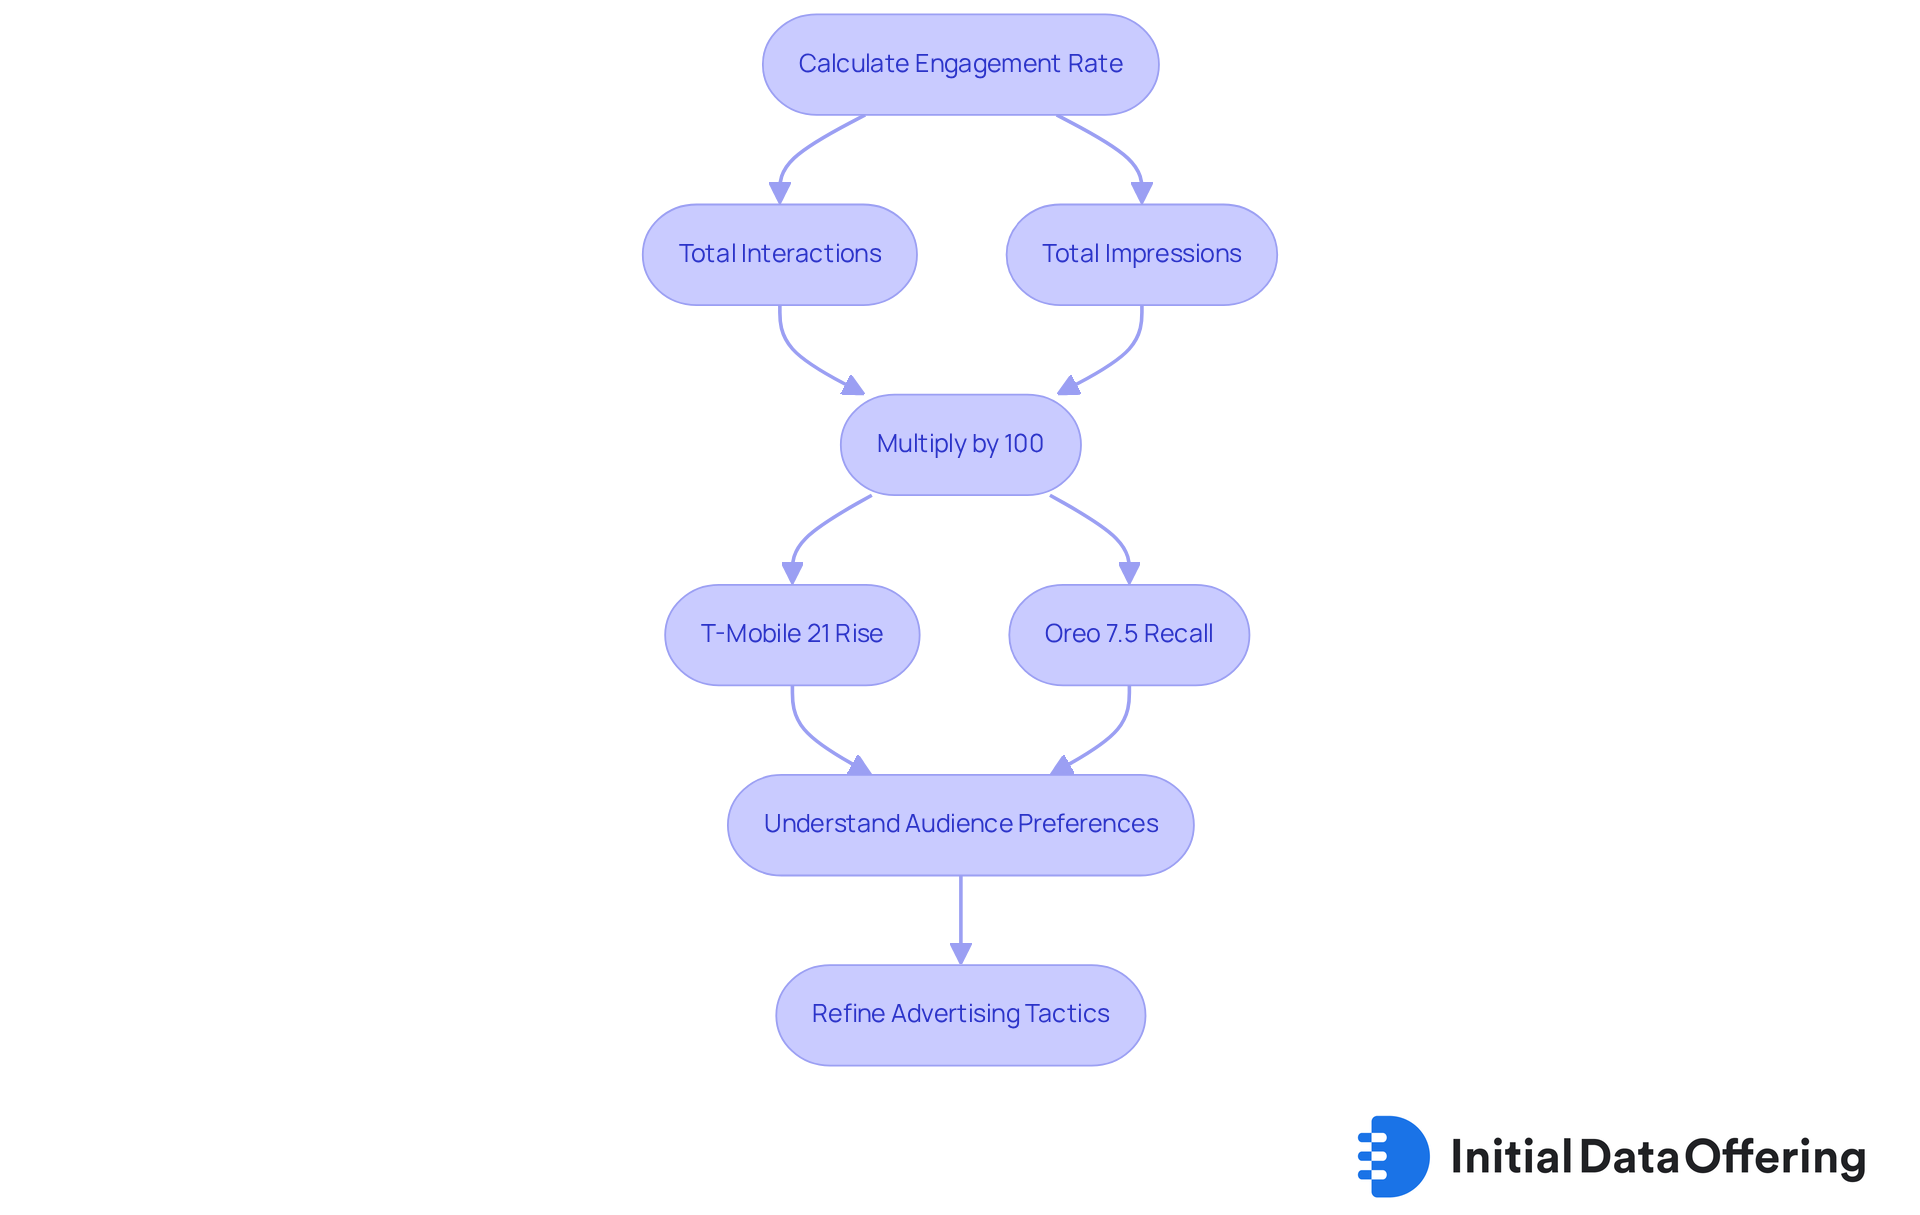
Engagement Rate serves as a crucial metric that quantifies user interaction with advertisements, encompassing likes, shares, comments, and clicks. To calculate the interaction level, one divides the total number of interactions by the total impressions and multiplies by 100. An increased level of involvement signifies a strong connection between the ad and the audience, fostering a deeper bond and greater interest.
For instance, T-Mobile's updated loyalty program realized an impressive 21% rise in program participation. This demonstrates how customized mobile experiences can significantly enhance user involvement. Similarly, Oreo's 'Stay Playful' campaign achieved over 80 million impressions and a 7.5% ad recall percentage. This showcases the effectiveness of personalized messaging in boosting audience engagement.
Social media marketers emphasize that understanding audience preferences is essential for enhancing interaction levels. As one expert noted, "Each creative should be mapped to specific targeting, ensuring that ads are served at optimal times for maximum impact." This strategy not only improves involvement but also ensures that the messaging aligns with the audience's interests.
Tracking participation levels is vital for analysts aiming to refine advertising tactics using advertising data and boost audience interaction. With studies indicating that 72% of consumers distrust loyalty programs, brands that prioritize genuine interaction can stand out in a crowded marketplace. By leveraging advertising data-driven insights, analysts can design campaigns that not only capture attention but also cultivate lasting connections with their target audiences.
Bounce Rate: Evaluate the Effectiveness of Your Landing Pages
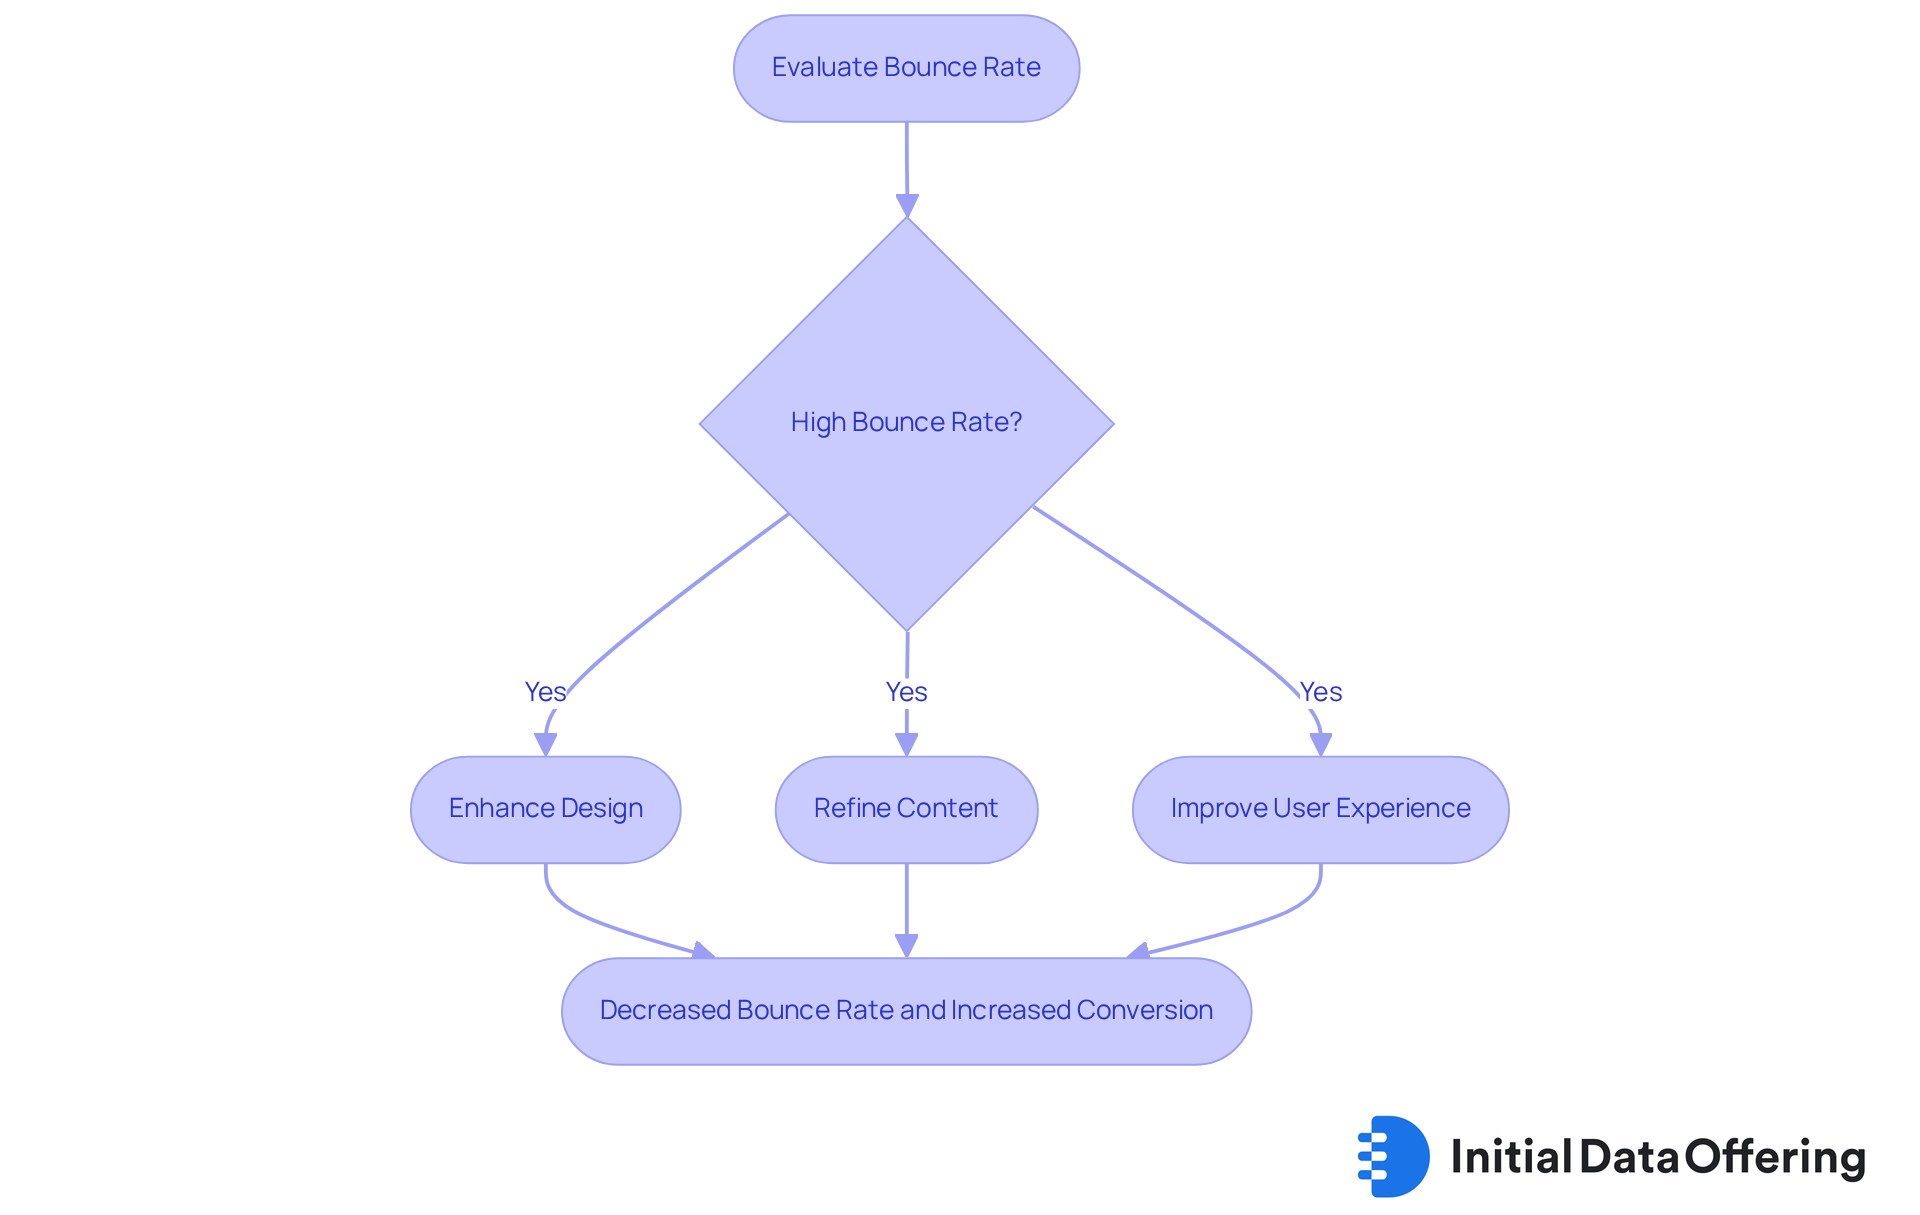
Bounce Rate represents the percentage of visitors who exit a landing page without engaging further. To calculate it, divide the number of single-page sessions by the total entries to the page and multiply by 100. A high bounce frequency often suggests that the landing page lacks engagement or relevance, indicating a need for optimization.
Strategies to minimize bounce occurrences include enhancing the design, refining content, and improving user experience. For instance, Strategic Pete noted, "Using funnel analytics and heatmapping tools like Hotjar, we identified that the landing pages linked to these podcasts were not optimized for conversion."
Statistics indicate that a well-organized landing page can decrease bounce figures by as much as 50%, directly affecting conversion numbers. Evaluating landing page effectiveness through bounce rate analysis allows analysts to identify areas for improvement, ensuring that visitors are more likely to take desired actions.
Brand Awareness Metrics: Assess the Impact of Advertising on Brand Recognition
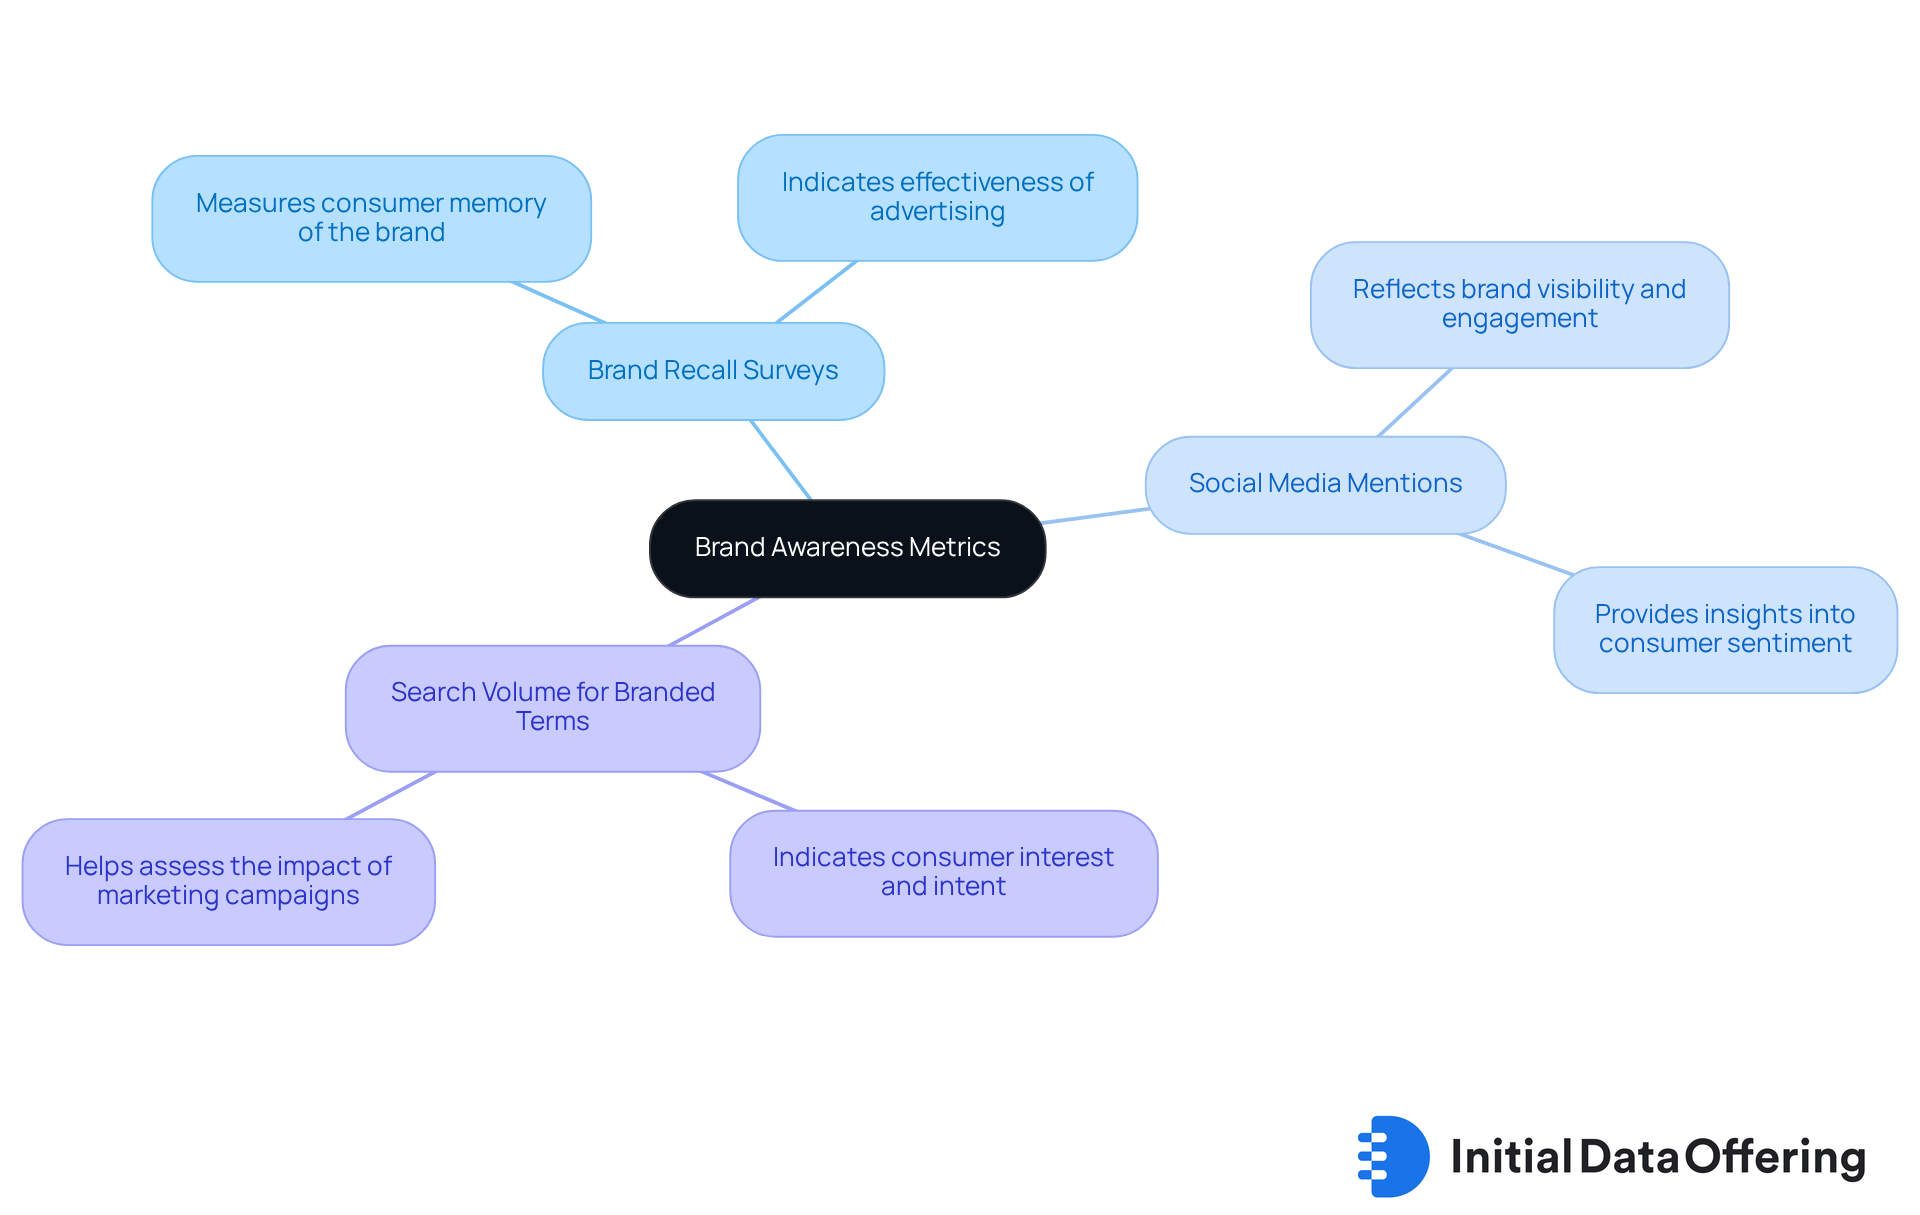
Brand Awareness Metrics include various indicators that gauge how effectively consumers recognize and remember a brand. Key indicators consist of:
- Brand recall surveys
- Social media mentions
- Search volume for branded terms
By monitoring these metrics, businesses can evaluate the influence of their advertising data on brand recognition and perception.
Why is this important? Prioritizing brand awareness is essential for marketers, as it serves as a foundational element of their strategies. This focus ensures that their initiatives contribute to long-term brand equity and foster customer loyalty.
In conclusion, understanding and utilizing brand awareness metrics can significantly enhance marketing effectiveness and drive sustainable growth.
Conclusion
Understanding the essential advertising data metrics is crucial for analysts aiming to optimize their marketing strategies and drive successful outcomes. The insights provided throughout this article highlight how metrics such as Customer Acquisition Cost, Return on Ad Spend, Click-Through Rate, and others serve as vital indicators of advertising performance. By leveraging these metrics, organizations can enhance their decision-making processes, ultimately achieving more effective advertising campaigns.
Key arguments presented underscore the importance of each metric in evaluating and refining advertising efforts. For instance, measuring Customer Lifetime Value allows businesses to focus on long-term relationships with clients, while Bounce Rate provides insights into landing page effectiveness. Furthermore, metrics like Engagement Rate and Impressions help gauge audience interaction and brand visibility, respectively. Each of these metrics plays a pivotal role in shaping a comprehensive advertising strategy that aligns with business goals.
In a rapidly evolving advertising landscape, the ability to access and analyze these metrics cannot be overstated. Organizations are encouraged to adopt a data-driven approach, continually reassessing their strategies based on these critical insights. By prioritizing the measurement and optimization of these essential advertising metrics, businesses can foster deeper connections with their audiences, enhance brand recognition, and ultimately drive sustainable growth in a competitive market.
Frequently Asked Questions
What is the Initial Data Offering (IDO)?
The Initial Data Offering (IDO) is a platform that simplifies the launch and exploration of new datasets, particularly in advertising data measurements. It serves as a centralized hub for data exchange, enhancing the accessibility and visibility of essential data resources.
How does IDO benefit analysts in advertising?
IDO allows analysts to efficiently locate the indicators necessary for evaluating advertising data performance and keeps them informed about the latest advertising data trends and insights, which are crucial for making informed advertising strategy decisions.
What is Customer Acquisition Cost (CAC)?
Customer Acquisition Cost (CAC) is a metric that evaluates the total expense involved in acquiring a new client through marketing and sales efforts. It is calculated by dividing the total costs associated with client acquisition by the number of new clients acquired over a defined period.
Why is monitoring CAC important?
Monitoring CAC is essential to ensure that customer acquisition strategies remain cost-effective. A lower CAC indicates a more effective marketing strategy, allowing businesses to allocate resources wisely and maximize their return on investment (ROI).
What is Return on Ad Spend (ROAS)?
Return on Ad Spend (ROAS) is a performance indicator that quantifies the revenue generated for every dollar invested in advertising. It is calculated by dividing the total revenue from an ad campaign by the total cost of that campaign.
How can ROAS inform advertising strategies?
A higher ROAS signifies a more profitable campaign, while a lower ROAS may indicate the need for strategic adjustments. Analysts should aim for a ROAS that surpasses industry benchmarks to enhance profitability and optimize resource allocation in future campaigns.