10 Tools to Simplify Your Complex Data Analysis

10 Tools to Simplify Your Complex Data Analysis
Introduction
In the digital age, the explosion of data presents organizations with both opportunities and challenges in making informed decisions. As businesses navigate increasingly complex datasets, the demand for effective analysis tools has never been more crucial. This article delves into ten innovative tools that simplify data analysis, enhancing dataset discovery and leveraging artificial intelligence for deeper insights.
How can organizations harness these tools to streamline their data processes? By doing so, they can gain a competitive edge in an ever-evolving market. Each tool offers unique features that not only facilitate data handling but also provide significant advantages, such as improved accuracy and efficiency. Ultimately, these benefits empower organizations to make better decisions and respond swiftly to market changes.
Initial Data Offering: Streamline Your Dataset Discovery Process
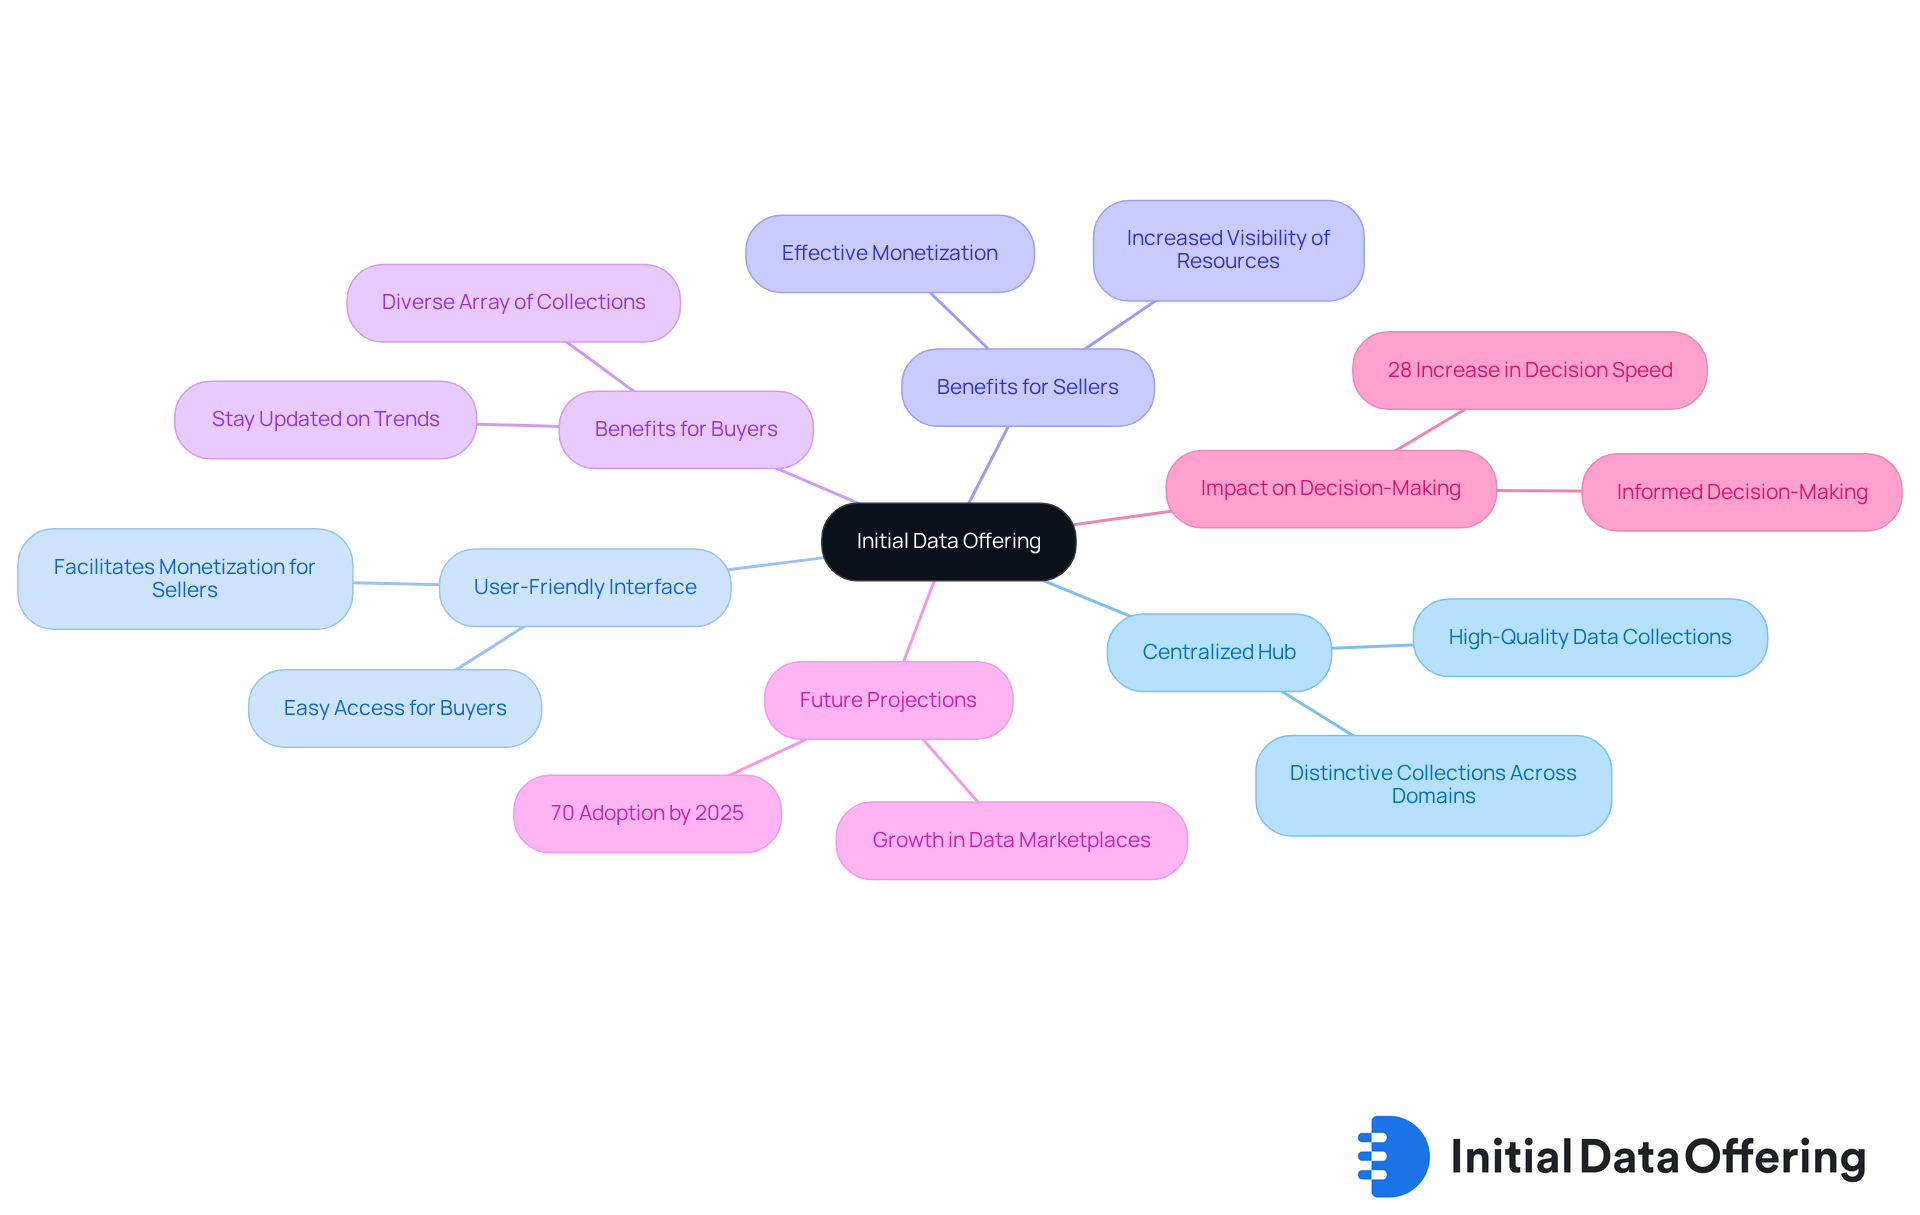
The Initial Information Offering (IDO) serves as a vital centralized hub for information exchange, significantly simplifying the discovery and access of high-quality complex data collections. By thoughtfully curating distinctive collections across various domains, IDO enhances the visibility of valuable resources. This empowers businesses and researchers to make informed decisions.
The platform boasts a user-friendly interface that facilitates effective monetization for information sellers. Meanwhile, buyers benefit from a diverse array of recently added collections, ensuring they stay updated on the latest trends and insights. Have you considered how such a platform could streamline your information management processes?
Looking ahead, by 2025, it is projected that around 70% of businesses will adopt centralized information exchange platforms. This trend underscores the growing reliance on these solutions for efficient information management. Successful implementations of dataset discovery tools, like those provided by IDO, have shown that organizations utilizing these resources can achieve a remarkable 28% increase in decision-making speed when handling complex data. This statistic highlights the critical role of dataset visibility in driving business success.
DCSC.ai: Leverage AI for Enhanced Data Relevance Scoring
DCSC.ai utilizes advanced AI algorithms to categorize companies into relevant sectors dynamically. This process generates a Relevance Score, which indicates how closely a company is connected to various industries. By employing this innovative tool, analysts and investors can pinpoint market opportunities more effectively, as it highlights the most critical complex data information points.
The advantages of using DCSC.ai are significant. It allows for rapid access to complex data, which enhances decision-making processes and strategic planning. Companies that have adopted DCSC.ai report improved accuracy in identifying emerging market trends. This capability enables them to adapt their strategies proactively, ensuring they remain competitive in a fast-paced market.
As AI technology continues to evolve, its role in enhancing the analysis of complex data and identifying market opportunities becomes increasingly vital. Industry leaders are beginning to recognize the potential of AI to transform how businesses approach market intelligence. How might your organization leverage such tools to stay ahead of the curve? By embracing these advancements, companies can not only improve their analytical capabilities but also position themselves for future success.
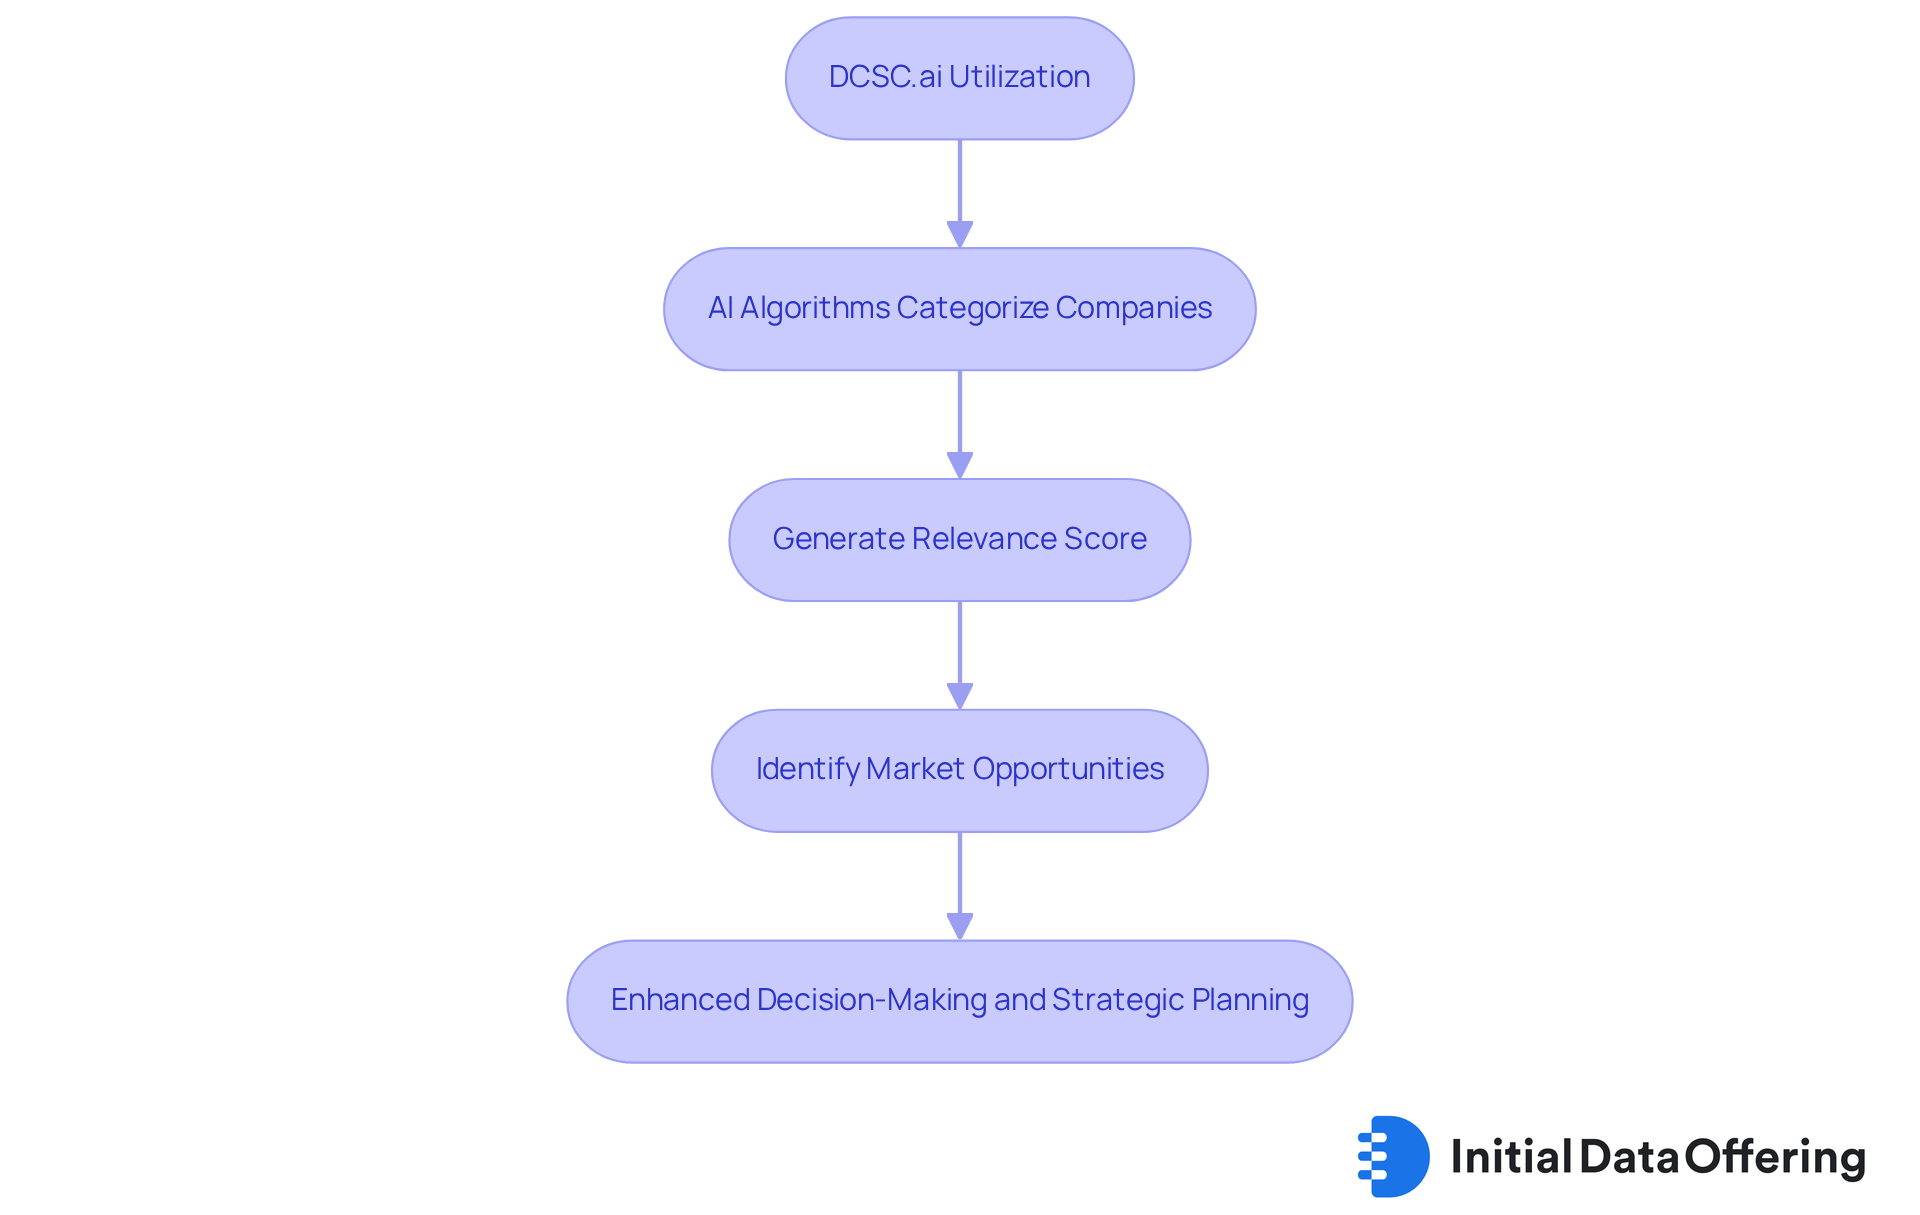
Tableau: Transform Complex Data into Visual Insights
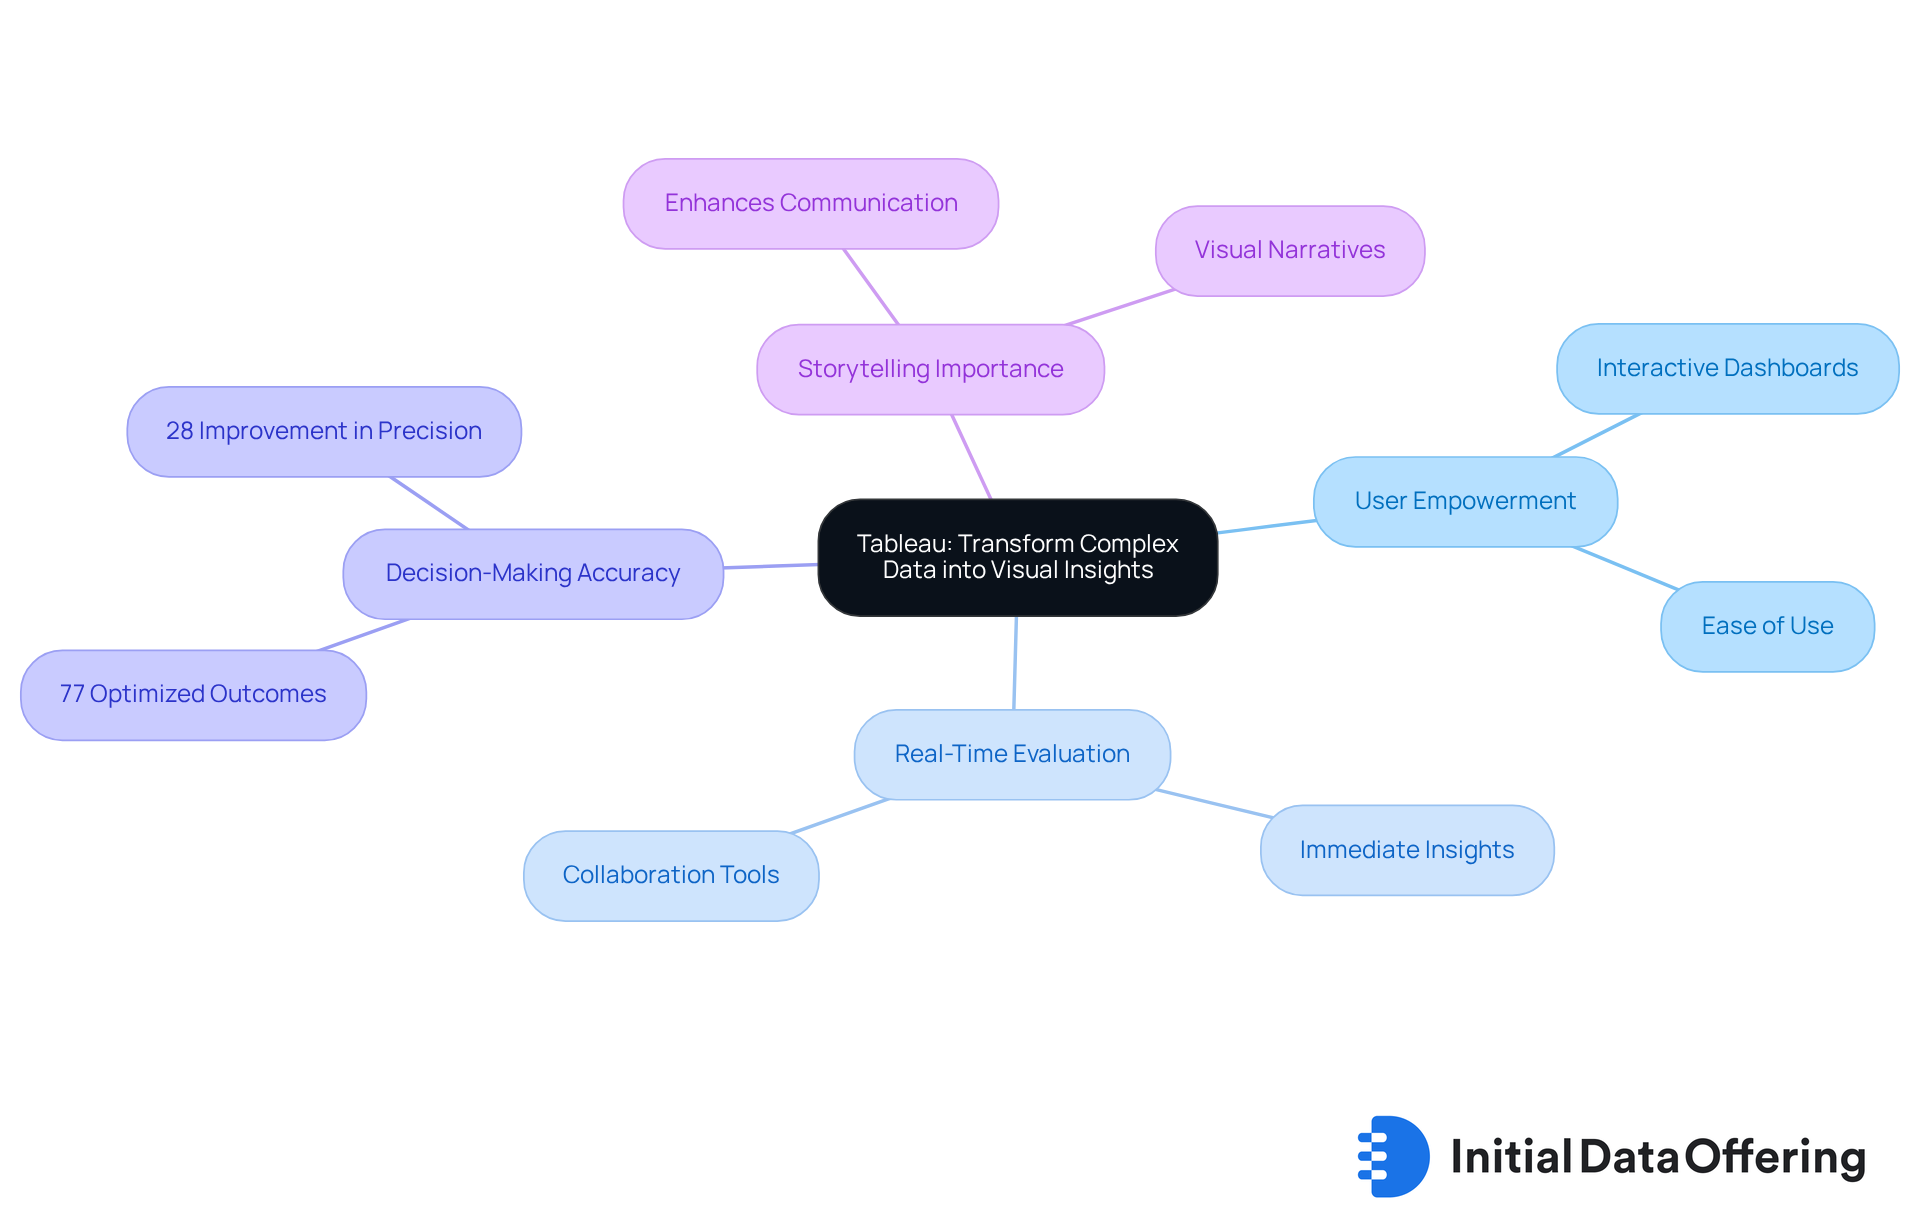
Tableau empowers users to create interactive and shareable dashboards that present information in a clear and engaging manner. Its intuitive drag-and-drop interface simplifies the transformation of complex data into meaningful visualizations. This feature allows users to quickly uncover insights, making data analysis more accessible.
The advantages of Tableau extend beyond ease of use. With real-time information evaluation and collaborative tools, it significantly boosts team efficiency in making evidence-based decisions. Organizations that leverage Tableau report notable improvements in decision-making accuracy. In fact, 77% of users experience optimized outcomes through effective visualization. This statistic highlights the tangible benefits of utilizing Tableau in a professional setting.
Moreover, organizations that employ visual representations alongside narratives enhance their decision-making precision by 28%. This underscores the essential role of storytelling in information evaluation. As industry specialist Robyn Mays emphasizes, "Information visualization plays a crucial role in information examination and interpretation." This statement reinforces the importance of effective information visualization in the decision-making process.
The implications of visual information are profound. It enriches discussions, bolsters strategies, enhances storytelling, and drives business expansion in an information-driven environment. Consequently, interactive dashboards have become vital for the evaluation of complex data in contemporary information analysis. How can your organization leverage Tableau to improve decision-making and drive growth?
Microsoft Power BI: Simplify Data Analysis and Reporting
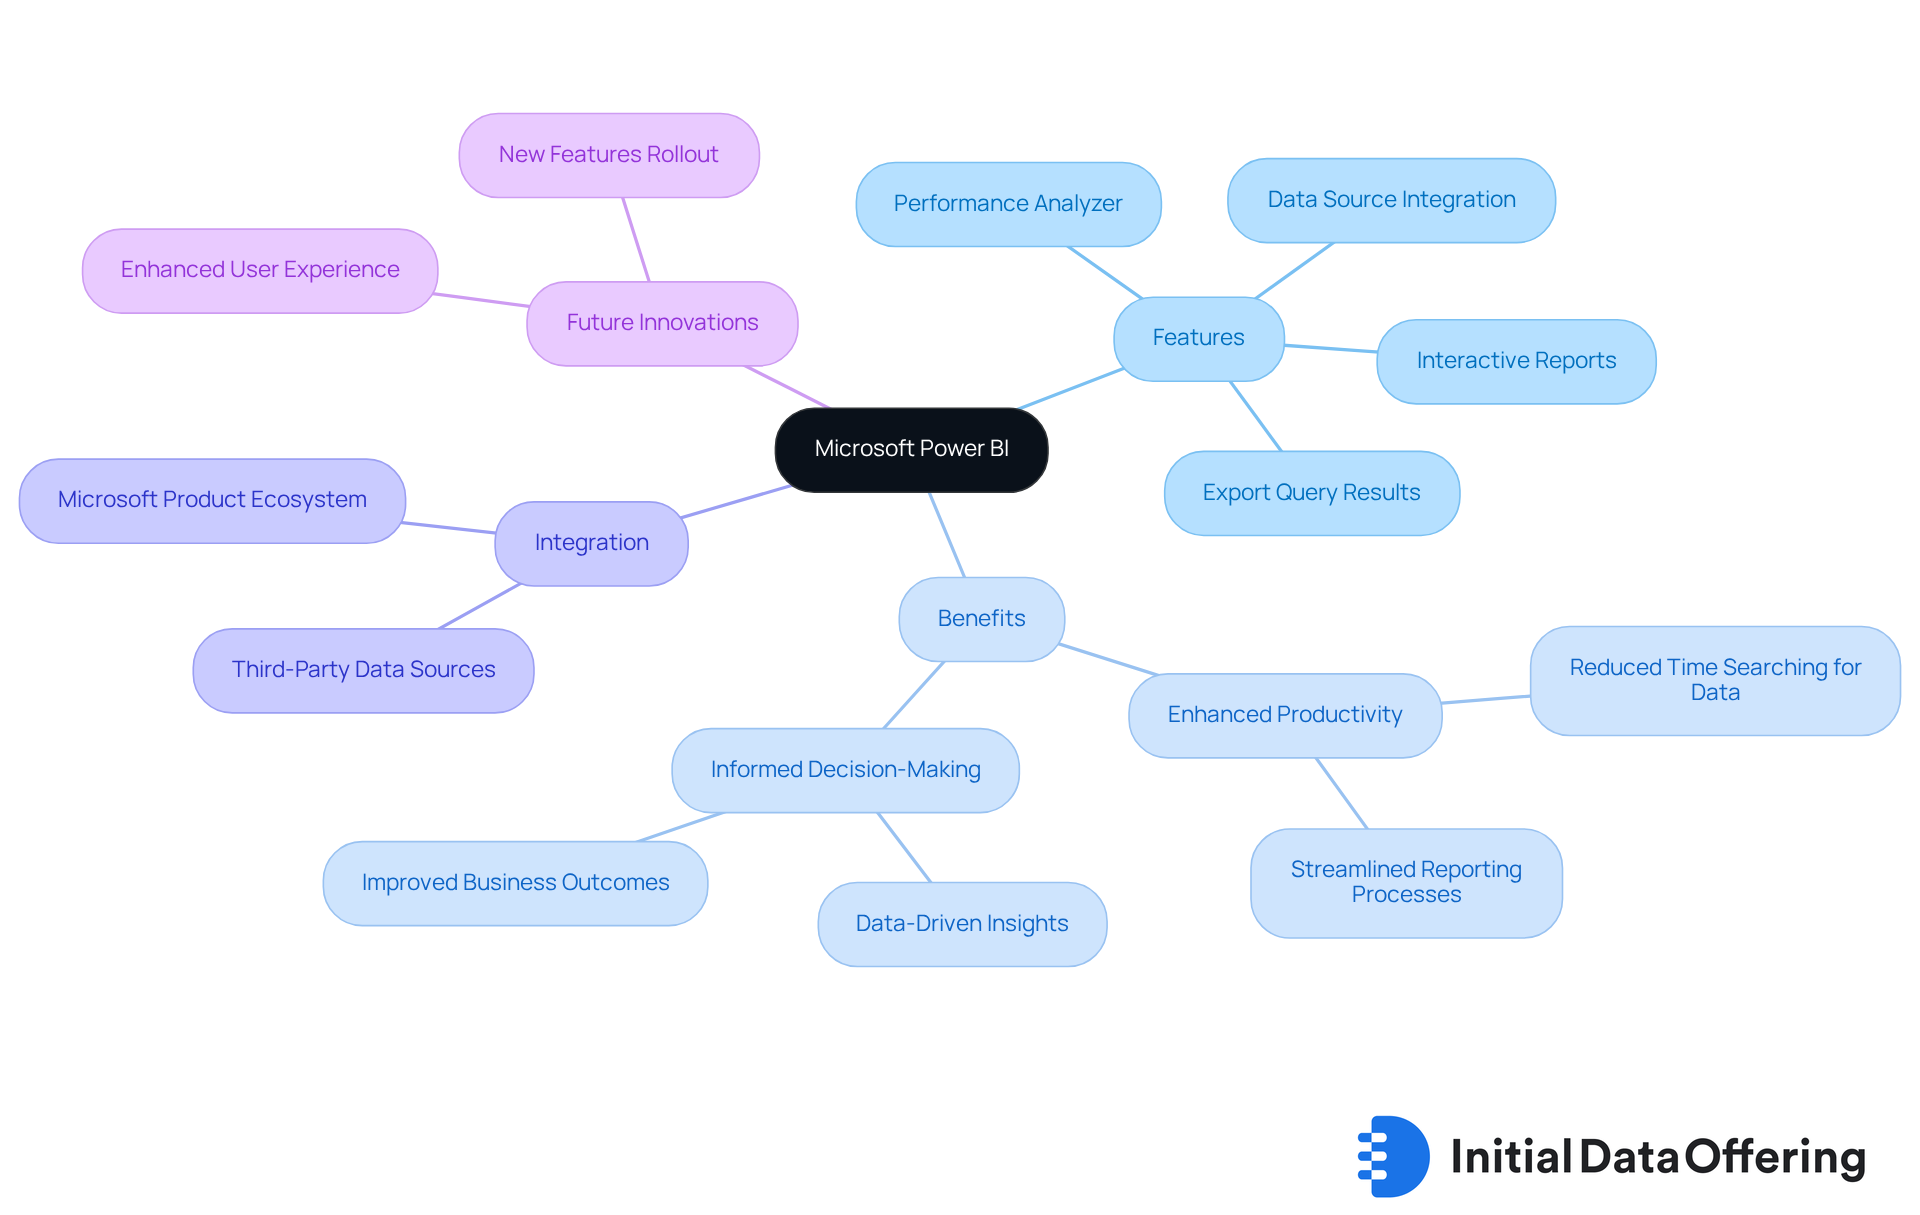
Microsoft Power BI offers a robust suite of tools designed to enhance visualization, reporting, and analysis. Its intuitive interface enables users to connect effortlessly to various data sources, facilitating the creation of interactive reports that can be easily shared among teams. This seamless integration with other Microsoft products significantly boosts its functionality, making Power BI a leading choice for organizations aiming to streamline their analysis workflows.
As we look ahead to 2025, Power BI continues to innovate, introducing features like the performance analyzer. This tool helps users evaluate visual load times in web reports, ultimately improving reporting efficiency. Organizations that leverage Power BI have reported notable improvements in their reporting processes. In fact, many employees spend 60% to 80% of their time searching for information. By simplifying access to data, Power BI not only enhances productivity but also empowers teams to make informed decisions quickly.
Consider companies that have adopted Power BI; they have successfully integrated multiple data sources, leading to more cohesive and actionable insights. In today’s data-driven landscape, the ability to analyze and report information efficiently can profoundly impact business outcomes. Industry experts emphasize that incorporating complex data sources into business intelligence tools like Power BI is essential for fostering a comprehensive understanding of market dynamics and advancing strategic initiatives.
How can your organization benefit from these capabilities? By embracing Power BI, you can enhance your reporting processes and empower your teams to make data-driven decisions that drive success.
Google Data Studio: Create Interactive Dashboards for Data Clarity
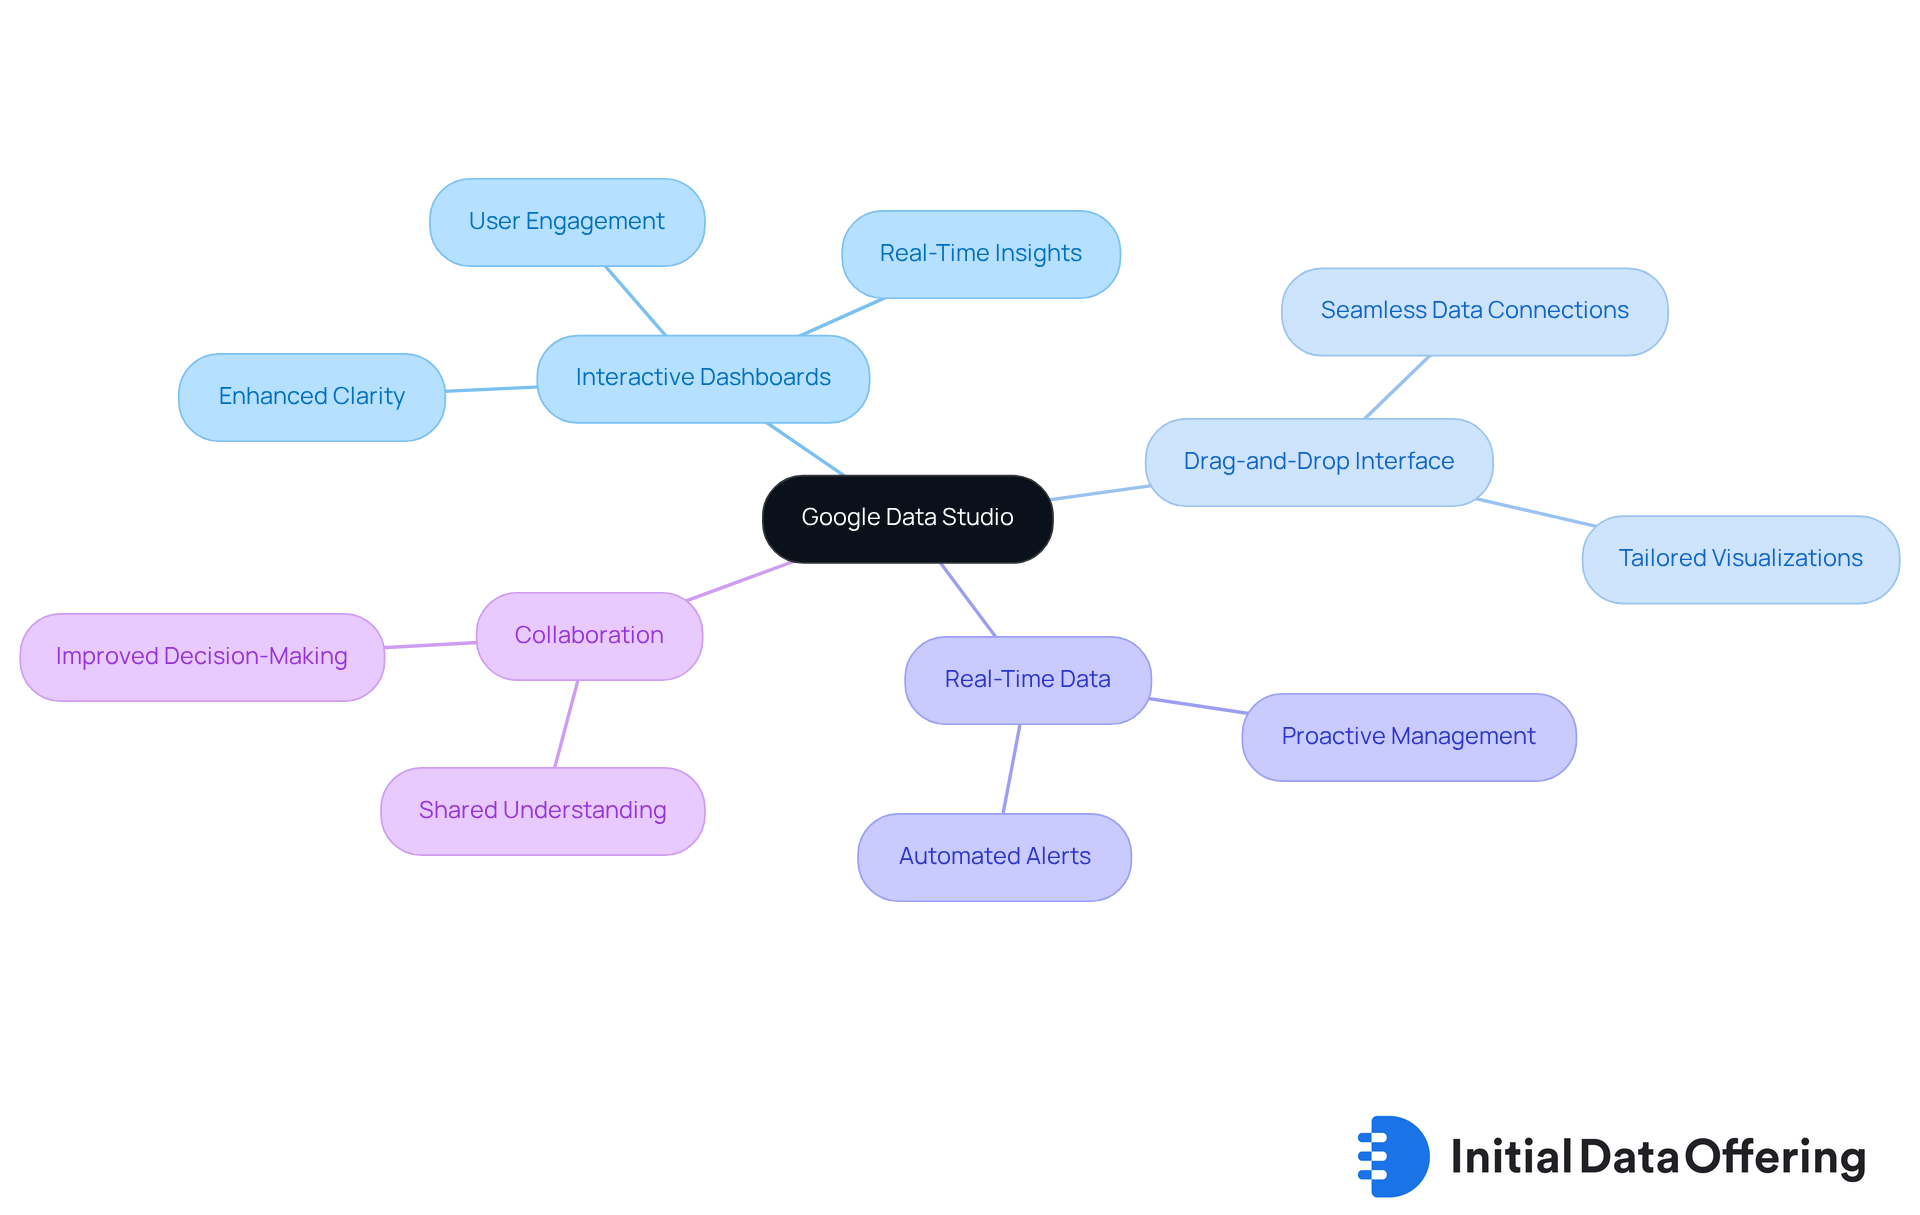
Google Data Studio offers users the ability to transform complex data into insightful dashboards and reports, significantly enhancing clarity. Its intuitive drag-and-drop interface allows for seamless connections to various data sources, which means users can create tailored visualizations that cater to specific analytical needs. This feature not only simplifies the reporting process but also promotes collaboration by facilitating the sharing of dashboards containing complex data with stakeholders.
By ensuring that critical insights are readily accessible to all team members, Google Data Studio fosters a shared understanding of performance metrics. This collaborative approach enhances decision-making across the organization through the use of complex data. Have you considered how real-time data can impact your team's performance? Recent updates in 2025 have introduced features like smart scorecards and automated alerts, which further streamline reporting and improve the overall user experience.
Organizations utilizing Google Data Studio have reported enhanced efficiency in analyzing complex data within their workflows, showcasing the platform's positive influence on team collaboration and operational effectiveness. As one expert noted, "real-time information promotes a culture of openness and responsibility within teams." This highlights the significance of interactive dashboards in facilitating effective collaboration. How might your organization benefit from adopting such tools?
Qlik Sense: Explore Data Associations for Deeper Insights
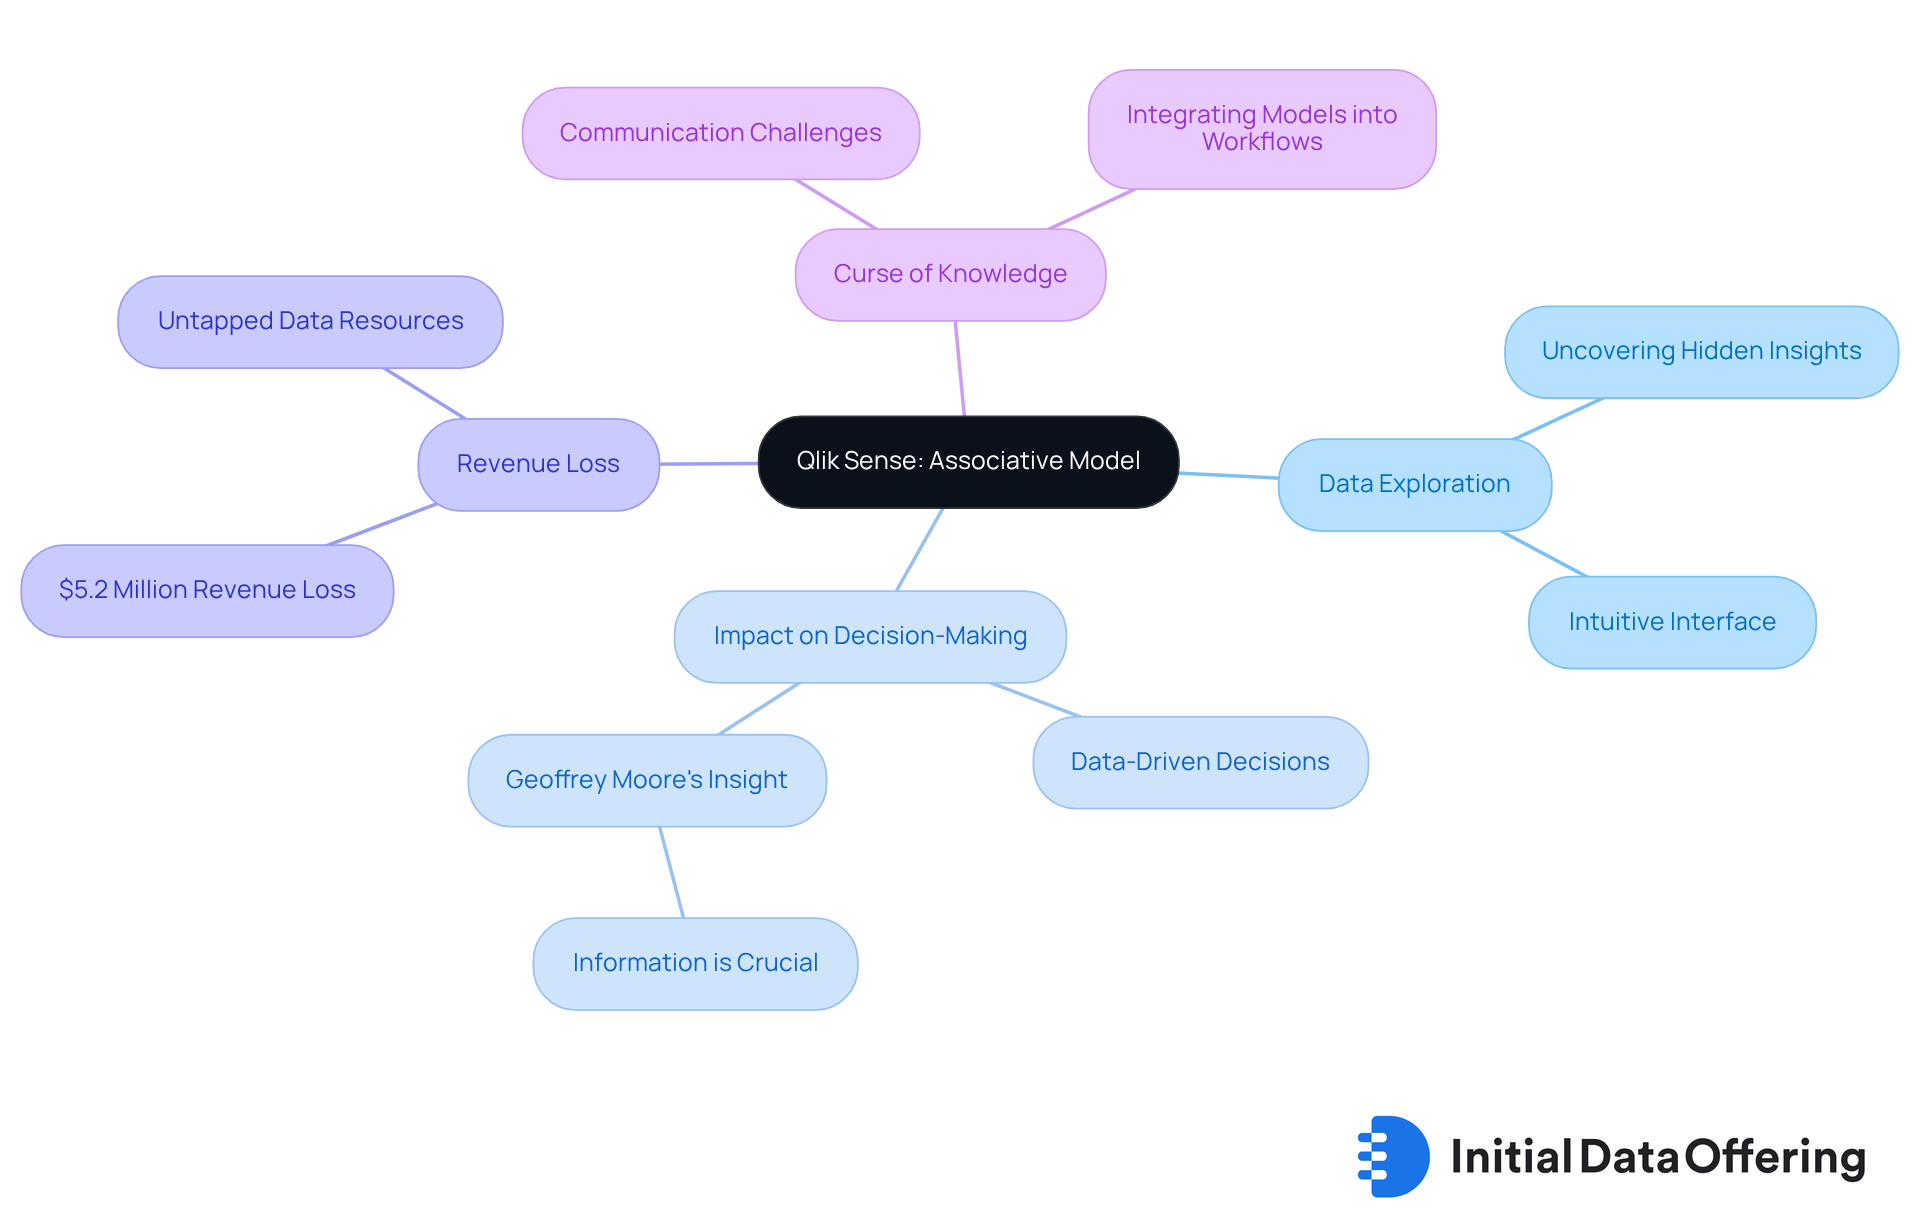
Qlik Sense employs an associative model that allows users to explore connections between various datasets with ease. This feature enables analysts to uncover hidden insights and trends in complex data that might not be apparent through traditional analysis techniques. As Geoffrey Moore aptly states, "information is absolutely crucial to making smart business decisions," underscoring the significance of effective information exploration.
With its intuitive interface and powerful visualization capabilities, Qlik Sense empowers users to make data-driven decisions based on insights from complex data. Organizations that have adopted Qlik Sense have reported significant improvements in their analytical capabilities. In fact, some studies suggest that companies lose out on $5.2 million in revenue due to unutilized information. This statistic emphasizes the necessity of utilizing tools like Qlik Sense for thorough analysis of complex data.
However, analysts must also be mindful of the 'Curse of Knowledge,' which can impede the effective communication of insights. To fully leverage the advantages of associative information models, analysts are encouraged to integrate these models into their workflows. This approach ensures they harness the complete potential of their insights, ultimately leading to more informed decision-making.
Alteryx: Blend and Analyze Data with Ease
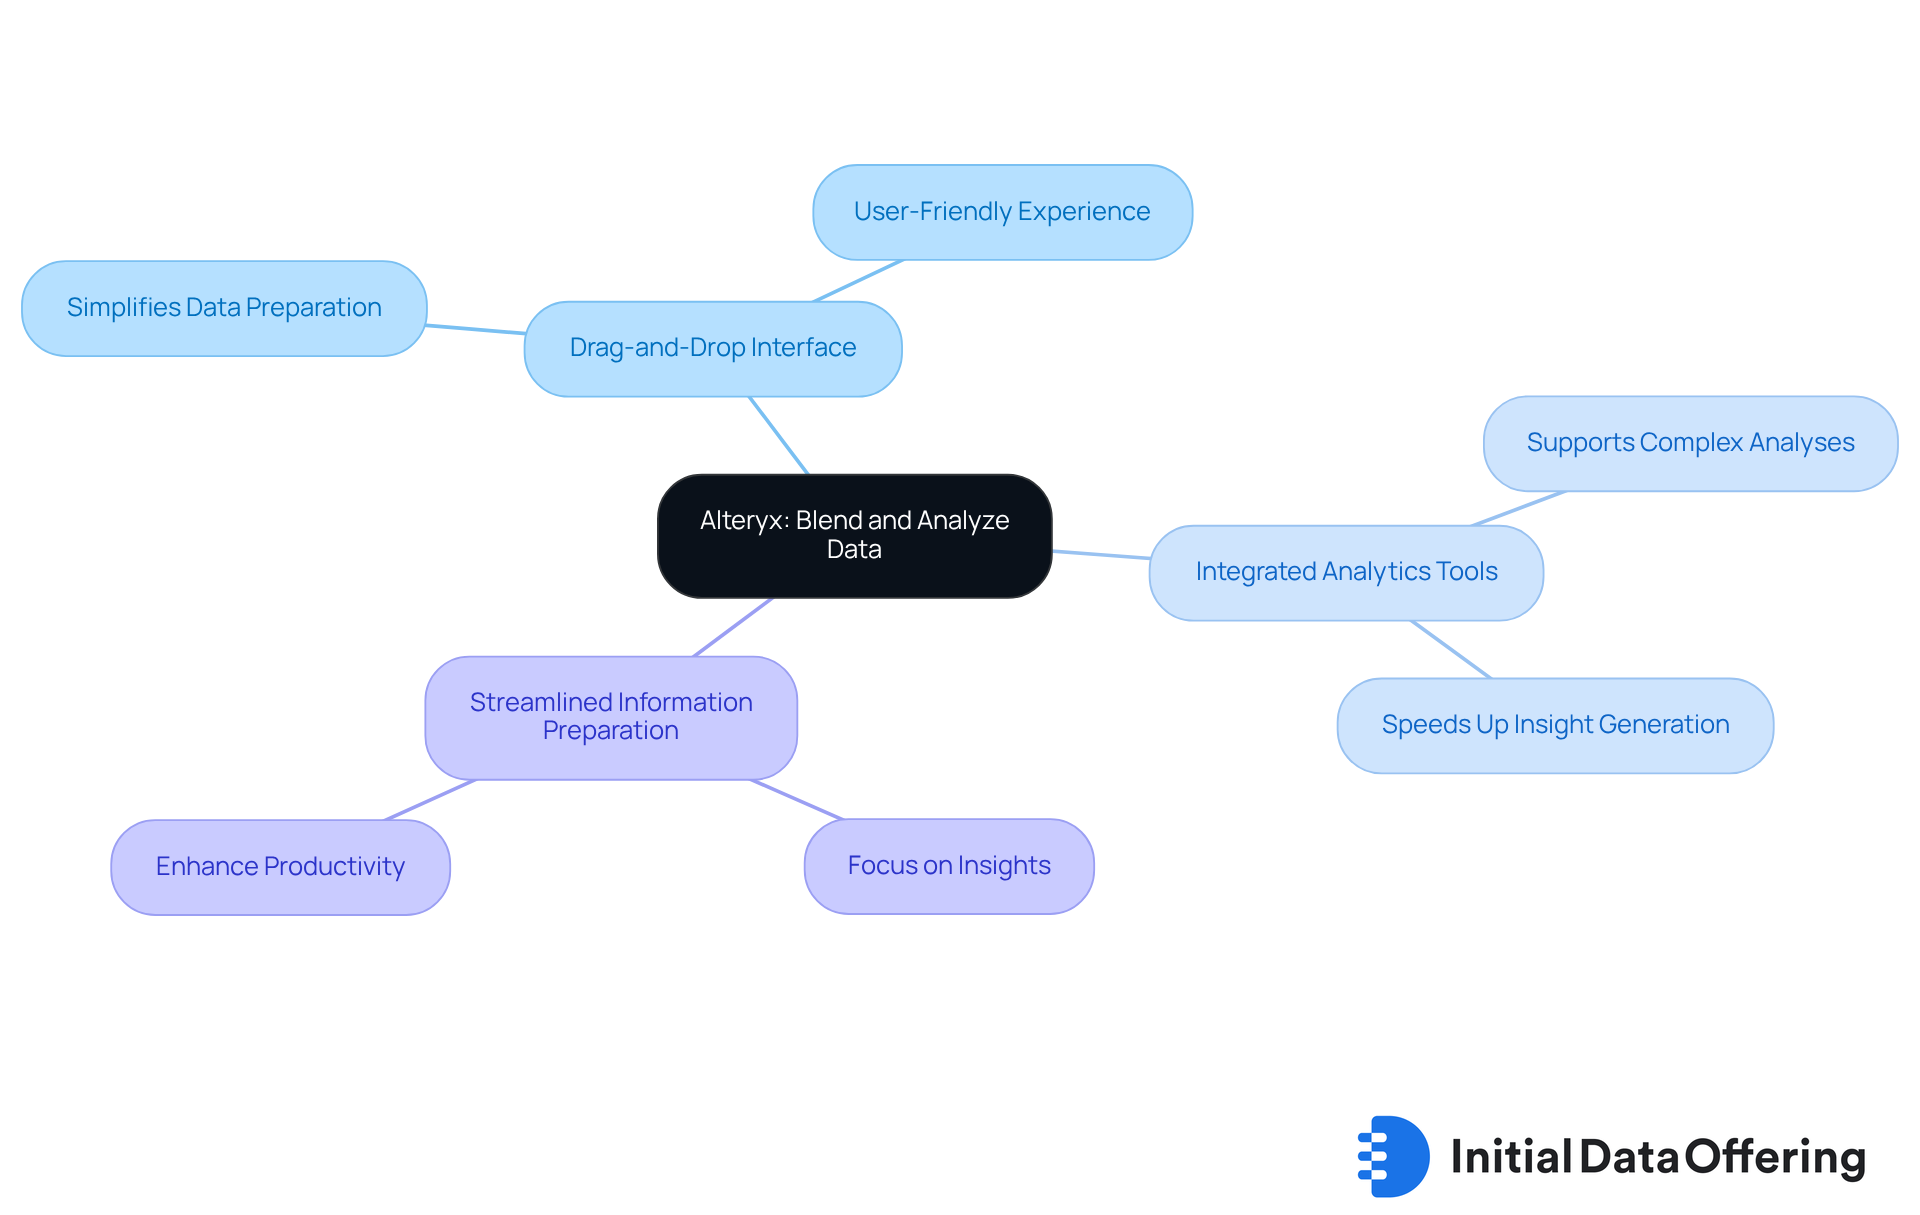
Alteryx is a powerful platform designed for blending information, allowing users to effortlessly combine inputs from various sources. Its user-friendly drag-and-drop interface simplifies the information preparation process significantly. This feature enables analysts to focus on deriving insights rather than getting bogged down in data manipulation.
With integrated analytics tools, Alteryx not only supports complex data analyses but also speeds up the generation of actionable insights. This advantage is crucial as organizations increasingly recognize that effective information preparation is key to informed decision-making. Have you considered how streamlining your information preparation could enhance your team's productivity?
As industry specialists note, improving information preparation can lead to greater efficiency, allowing analysts to concentrate on strategic initiatives rather than routine tasks. By leveraging Alteryx, organizations can transform their data handling processes, ultimately driving better business outcomes.
IBM Watson Analytics: Automate Insights from Complex Data
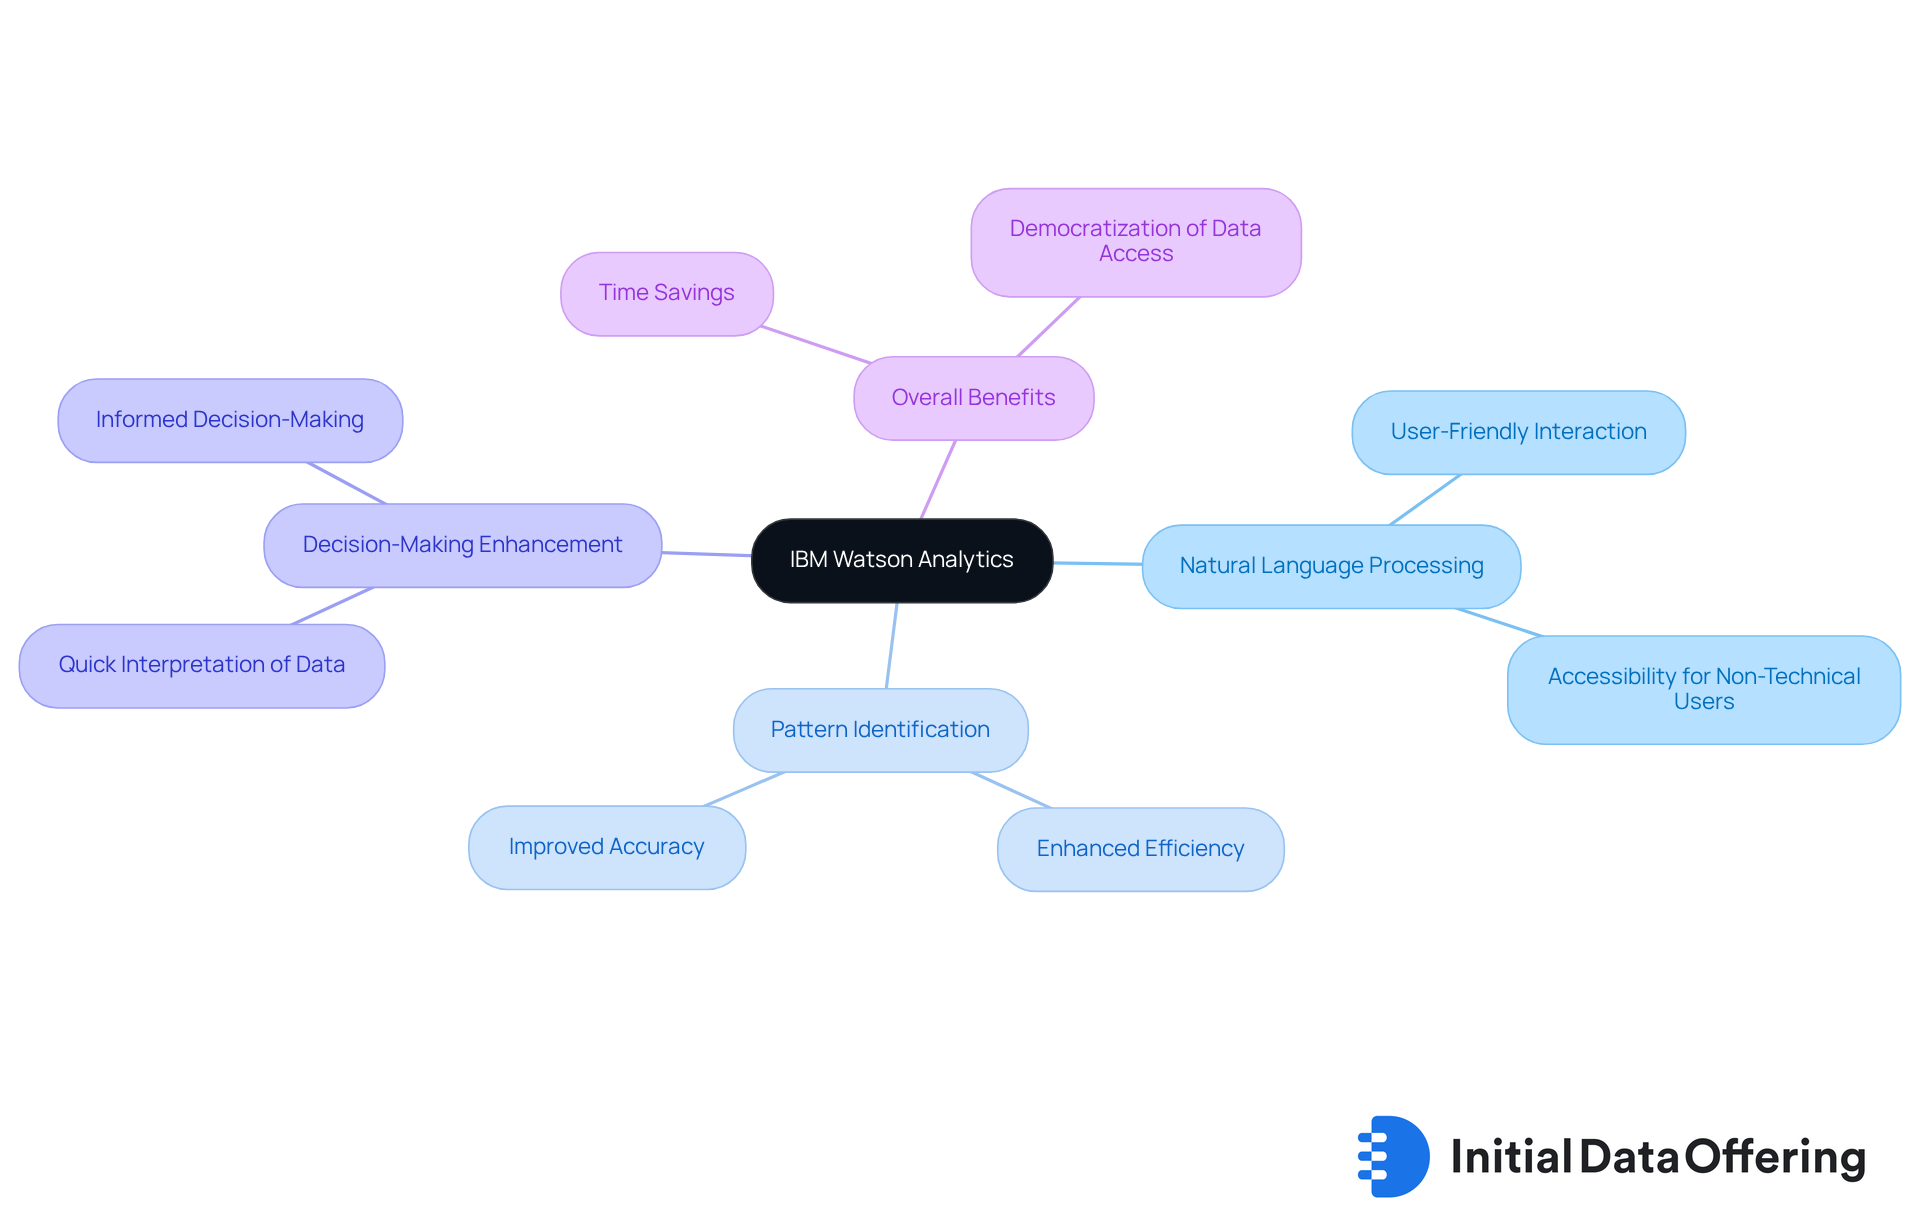
IBM Watson Analytics harnesses the power of artificial intelligence to streamline the process of extracting insights from complex data. What does this mean for you? By identifying patterns and trends, Watson not only provides practical suggestions but also significantly enhances your decision-making capabilities.
One of the standout features of Watson is its natural language processing capabilities. This allows users to interact with data using everyday language, making it accessible even for those without a technical background. Imagine being able to ask questions about your data as easily as you would discuss it with a colleague. This feature transforms the way individuals engage with information, breaking down barriers to understanding.
The advantages of using IBM Watson Analytics extend beyond mere data analysis. By simplifying the examination of information, it empowers users to make informed decisions quickly and effectively. Consider this: how much time could you save if you could easily interpret complex data? The benefits are clear:
- Enhanced efficiency
- Improved accuracy in decision-making
- A more intuitive approach to data analysis
In conclusion, IBM Watson Analytics not only automates insights generation but also democratizes data access. As you explore its capabilities, think about how these tools can be integrated into your workflow to drive better outcomes. With Watson, the future of data analysis is not just about numbers; it's about making data work for you.
SAS Visual Analytics: Simplify Data Analysis with Advanced Tools
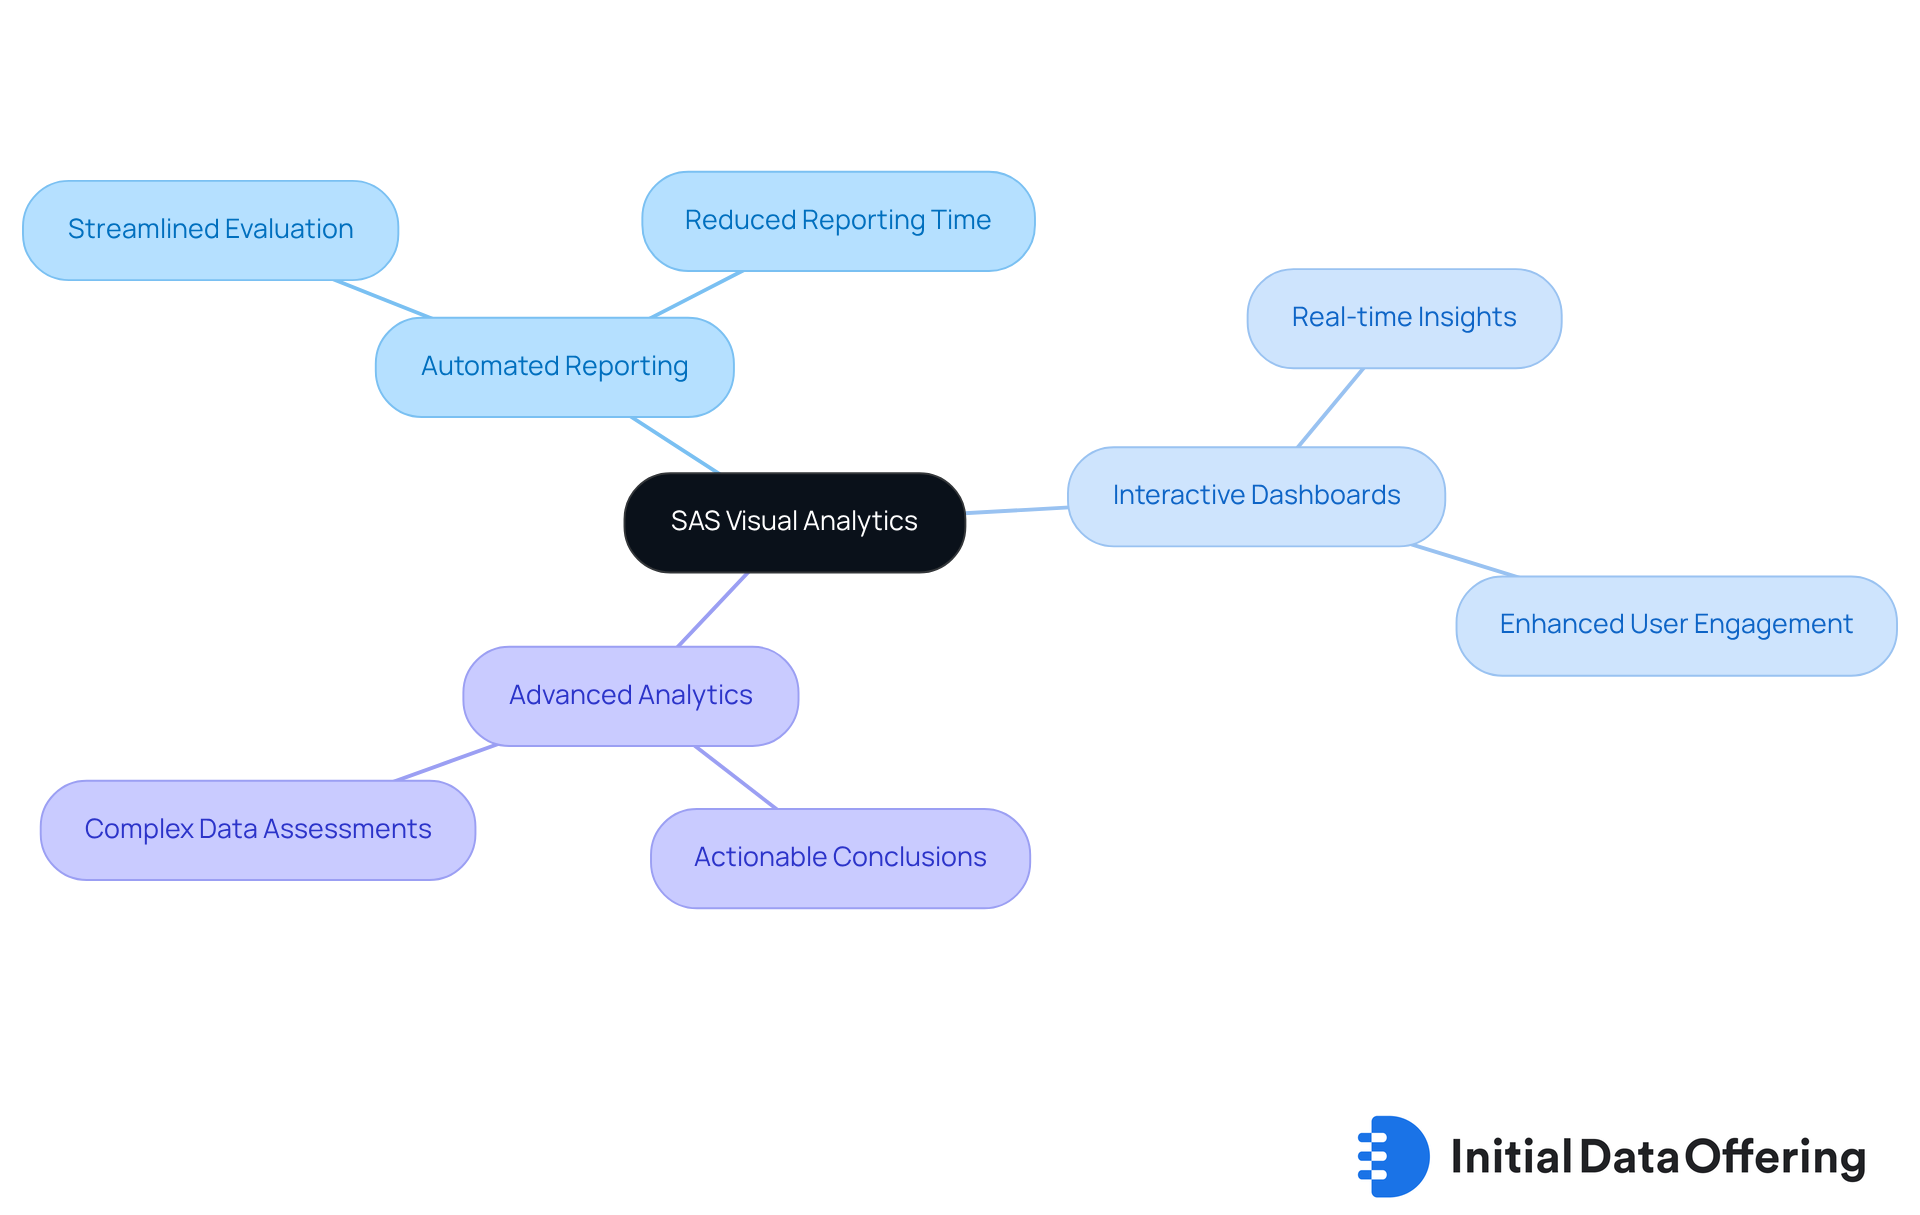
SAS Visual Analytics provides a comprehensive suite of tools designed for exploration, visualization, and reporting, making it an essential asset for organizations aiming to simplify complex data evaluations. Its advanced analytics capabilities allow users to conduct intricate assessments on complex data and derive actionable conclusions swiftly. Key features, such as automated reporting and interactive dashboards, significantly enhance the analysis process, empowering organizations to make informed decisions based on real-time insights.
As Peter Sondergaard aptly noted, "information is often considered more valuable than oil, but like oil, it is useless until properly mined and analyzed." This statement underscores the critical role of effective analytics in decision-making. Moreover, with 67% of analytics leaders identifying organizational culture as a significant barrier to becoming a metrics-driven company, SAS Visual Analytics helps organizations navigate these challenges by offering user-friendly tools that enhance information accessibility.
Consider this: individuals spend 60% to 80% of their time searching for information. The automated reporting and interactive dashboards of SAS Visual Analytics are crucial in streamlining the evaluation process of complex data. Organizations that leverage SAS Visual Analytics can enhance their reporting capabilities, ensuring that complex data is both accessible and meaningful.
A notable example is a leading retail firm that utilized SAS to transform its information evaluation approach, resulting in a 30% reduction in reporting time and a substantial increase in actionable intelligence. This aligns with the notion that effective information analysis turns raw data into valuable insights, ultimately driving improved business outcomes.
Looker: Integrate and Simplify Data Reporting
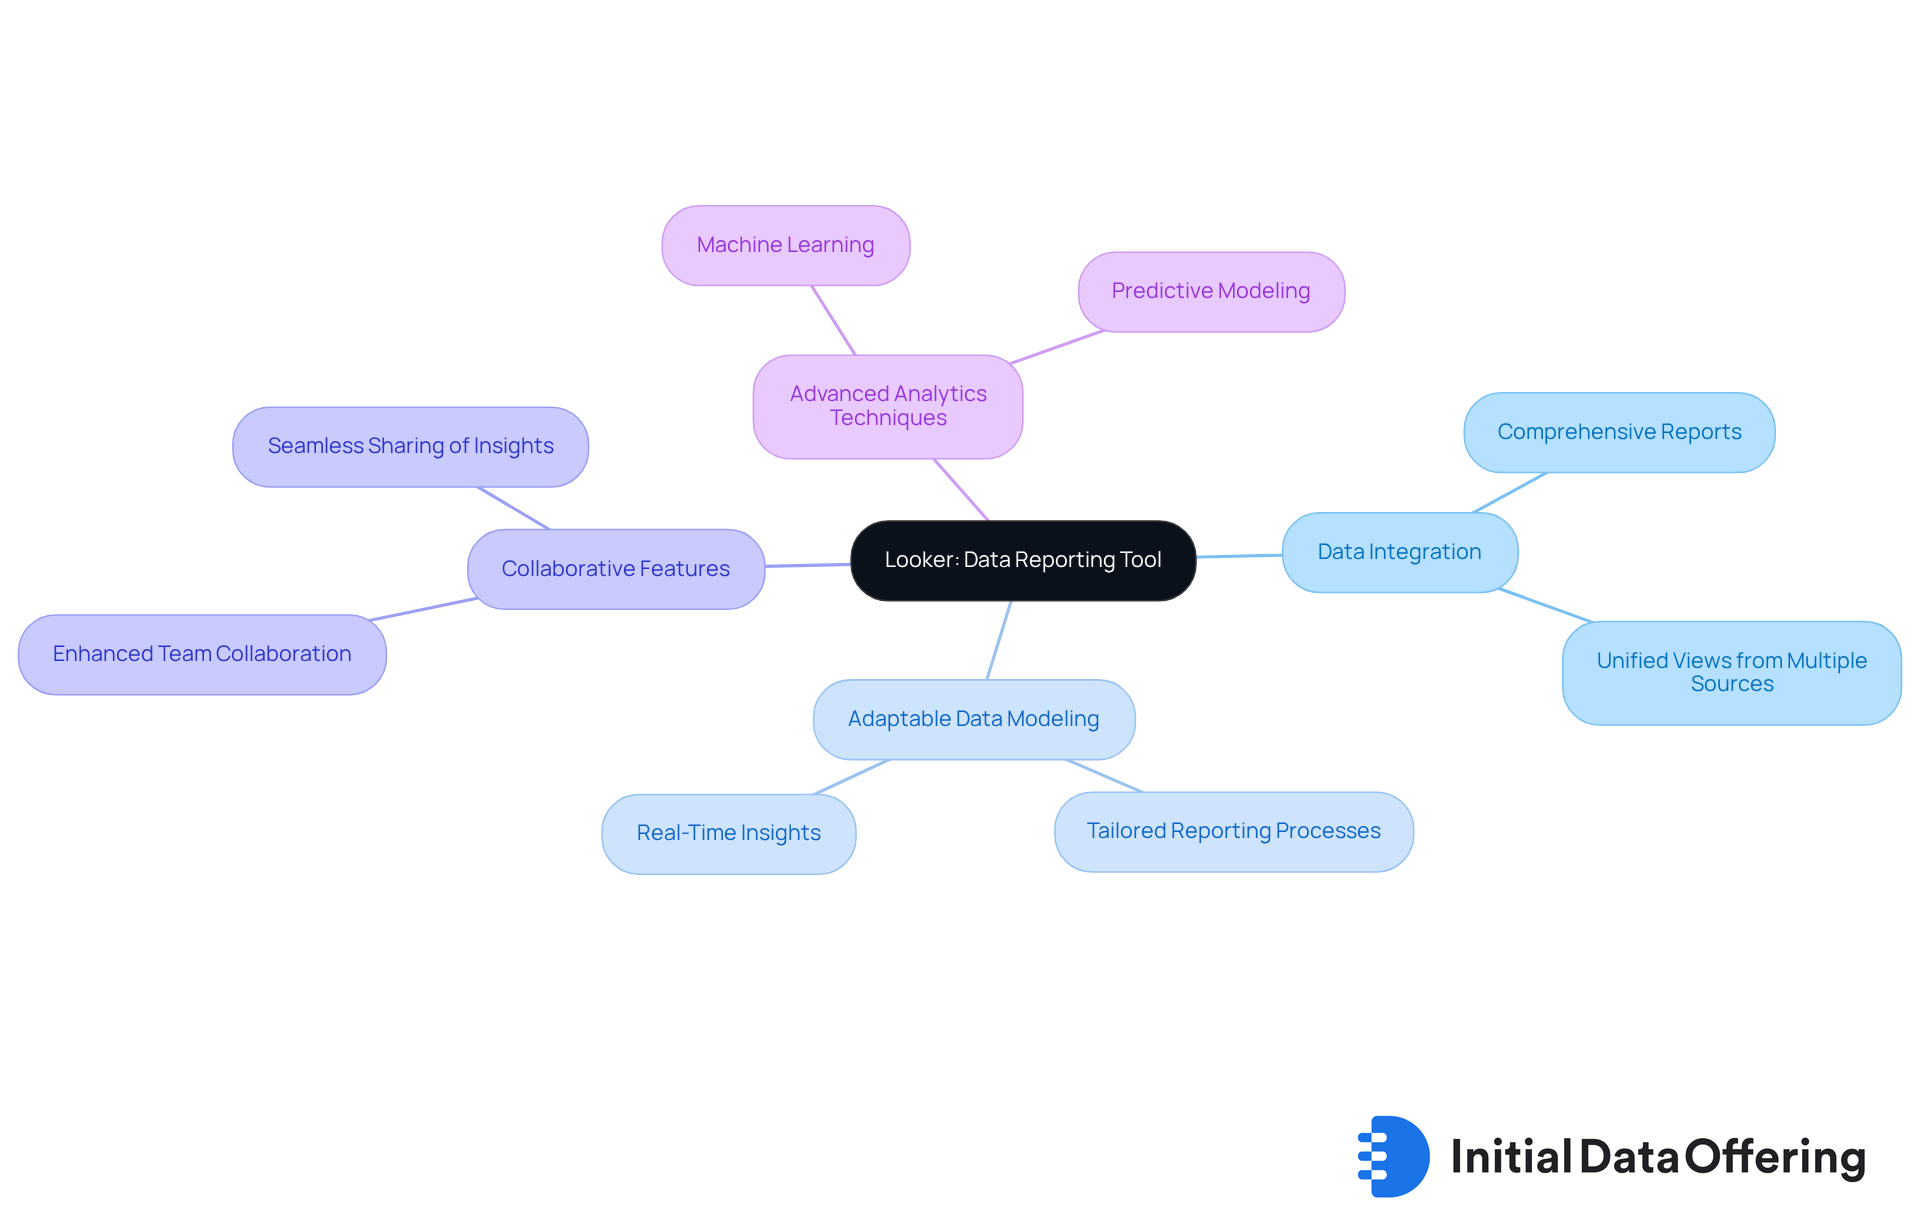
Looker empowers organizations to integrate complex data from diverse sources, resulting in comprehensive reports that significantly enhance business intelligence. Its key features include adaptable data modeling, which allows users to tailor their reporting processes to meet specific business needs. This flexibility not only streamlines reporting but also ensures that insights are relevant and actionable.
The advantages of Looker extend beyond mere data integration. With its collaborative features, teams can share insights seamlessly, fostering a culture of data-driven decision-making. This collaboration enhances overall organizational performance, as teams work together to interpret data and implement strategies effectively.
How can Looker transform your organization’s approach to data? By leveraging its capabilities, businesses can improve their reporting accuracy and drive better outcomes through informed decisions made from complex data. In a world where data is paramount, Looker stands out as a vital tool for any organization aiming to thrive.
Conclusion
The exploration of tools for simplifying complex data analysis reveals a landscape where technology significantly enhances decision-making processes across various industries. By leveraging innovative platforms such as the Initial Data Offering, DCSC.ai, Tableau, and others, organizations can streamline their data management and analysis. This ultimately leads to more informed and timely business decisions.
Key insights from the article highlight several features of these tools:
- User-friendly interfaces
- Advanced AI capabilities
- Effective data visualization techniques
Each tool not only improves accessibility to complex data but also fosters collaboration and enhances team efficiency. For instance, platforms like Power BI and Google Data Studio emphasize the importance of real-time data sharing and interactive dashboards. Meanwhile, Qlik Sense and Alteryx focus on uncovering deeper insights through data associations and seamless data blending.
As businesses move toward 2025, embracing these advanced data analysis tools will be crucial for staying competitive in an increasingly data-driven world. Organizations are encouraged to evaluate their current data management practices. How can integrating these solutions enhance their analytical capabilities? By doing so, they can unlock the full potential of their data, driving better outcomes and fostering a culture of informed decision-making that propels long-term success.
Frequently Asked Questions
What is the Initial Data Offering (IDO)?
The Initial Data Offering (IDO) is a centralized hub for information exchange that simplifies the discovery and access of high-quality complex data collections, enhancing visibility and empowering businesses and researchers to make informed decisions.
How does IDO benefit information sellers and buyers?
IDO provides a user-friendly interface that facilitates effective monetization for information sellers, while buyers have access to a diverse array of recently added collections, keeping them updated on the latest trends and insights.
What is the projected trend for centralized information exchange platforms by 2025?
It is projected that around 70% of businesses will adopt centralized information exchange platforms by 2025, indicating a growing reliance on these solutions for efficient information management.
What impact does IDO have on decision-making speed?
Organizations utilizing dataset discovery tools like those provided by IDO can achieve a 28% increase in decision-making speed when handling complex data, highlighting the importance of dataset visibility.
What is DCSC.ai and how does it work?
DCSC.ai is a tool that uses advanced AI algorithms to categorize companies into relevant sectors and generate a Relevance Score, indicating how closely a company is connected to various industries.
What advantages do companies gain by using DCSC.ai?
Companies using DCSC.ai experience rapid access to complex data, improved accuracy in identifying emerging market trends, and enhanced decision-making processes, allowing them to adapt strategies proactively.
How does Tableau help in data visualization?
Tableau enables users to create interactive and shareable dashboards that transform complex data into meaningful visualizations, making data analysis more accessible through its intuitive drag-and-drop interface.
What are the benefits of using Tableau for organizations?
Organizations leveraging Tableau report improved decision-making accuracy, with 77% of users experiencing optimized outcomes through effective visualization, and a 28% enhancement in decision-making precision when combining visual representations with narratives.
What role does storytelling play in data visualization according to industry specialists?
Storytelling enhances decision-making precision, as effective information visualization is crucial for information examination and interpretation, enriching discussions and driving business expansion.
Why are interactive dashboards important in contemporary information analysis?
Interactive dashboards are vital for evaluating complex data, enriching discussions, bolstering strategies, and enhancing storytelling, which are essential for success in an information-driven environment.