Create an Online Dashboard: 5 Steps for Market Analysis Success

Create an Online Dashboard: 5 Steps for Market Analysis Success
Overview
This article provides an overview of creating an effective online dashboard for market analysis, outlining five essential steps for success.
-
First, it emphasizes the importance of clarity in design. A clear design not only enhances user experience but also ensures that the data presented is easily interpretable. This clarity allows users to make informed decisions quickly, which is crucial in today’s fast-paced market environment.
-
Next, the selection of appropriate tools is highlighted. Choosing the right tools can significantly impact the functionality of the dashboard. The right tools streamline data collection and analysis, making it easier for organizations to derive actionable insights from their data.
-
Thorough testing and refinement are also critical steps. Testing ensures that the dashboard functions as intended and meets user needs. Refinement based on user feedback can lead to continuous improvement, ultimately enhancing the dashboard's effectiveness.
These steps contribute to improved data-driven decision-making and operational efficiency within organizations. By implementing these strategies, businesses can leverage their data more effectively, leading to better outcomes.
How can these insights apply to your organization? Consider the potential benefits of a well-designed dashboard in your decision-making processes.
Introduction
Online dashboards have transformed how organizations analyze market data, turning complex information into clear, actionable insights. These dynamic tools offer several features:
- They enhance decision-making speed
- They provide a competitive edge in an increasingly data-driven landscape
The advantages of using online dashboards are significant; they allow businesses to respond quickly to market changes and make informed decisions based on real-time data. Ultimately, the benefits are clear: organizations that effectively utilize dashboards can improve their operational efficiency and strategic planning.
However, with a plethora of options available, how can businesses ensure they create a dashboard that truly meets their analytical needs and engages users effectively? It's essential to consider the specific requirements of your organization and the preferences of your users. By focusing on user experience and relevant data visualization, companies can design dashboards that not only inform but also inspire action.
In conclusion, the right dashboard can be a game-changer for any organization. It’s not just about having data at your fingertips; it’s about making that data work for you. Are you ready to harness the power of online dashboards to elevate your decision-making process?
Define Online Dashboards and Their Importance in Market Analysis
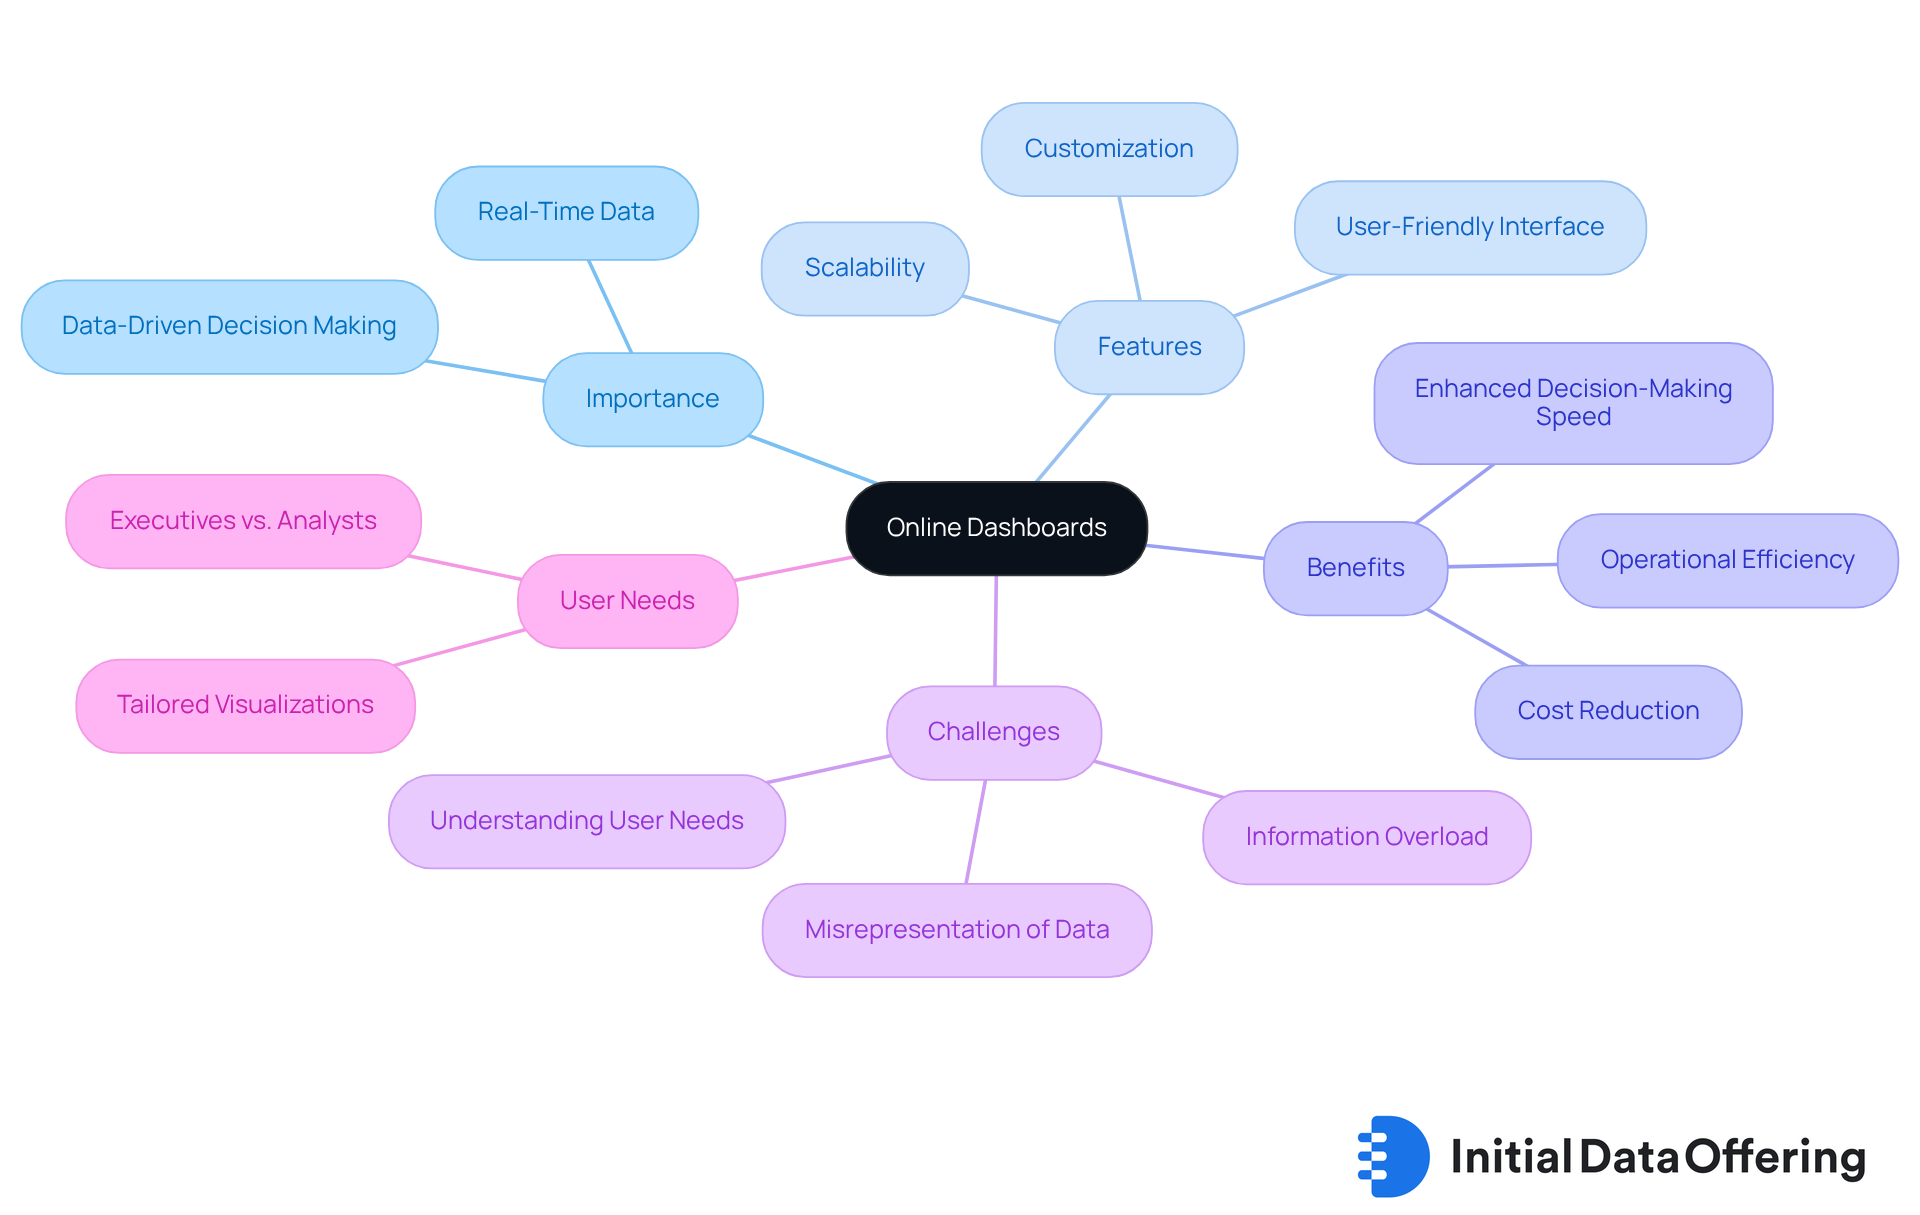
Online dashboards serve as dynamic, interactive tools that compile and display information from various sources. They allow users to track key performance indicators (KPIs) and metrics in real-time using an online dashboard, which is particularly crucial in the field of trade evaluation. These displays provide an organized and clear perspective of intricate datasets on an online dashboard, enabling companies to make quick, informed choices. How can this clarity help your organization recognize emerging trends and monitor performance metrics effectively?
By utilizing an online dashboard for visual displays, organizations can significantly enhance their data-driven decision-making processes. This capability is essential for maintaining a competitive advantage in today’s fast-paced business environment by utilizing an online dashboard. Moreover, the scalability of these visual tools, which include an online dashboard, ensures they can support business expansion, making them a sustainable solution for evolving market demands. Personalization and adaptability in interface design enable users to utilize an online dashboard to customize visual representations according to their distinct KPIs, thereby improving usability and effectiveness.
However, understanding the audience for these displays is equally important. Different user needs—such as those of executives versus data analysts—can greatly influence design choices. While data displays offer numerous advantages, challenges like information overload or misrepresentation can hinder their effectiveness. Organizations that employ an online dashboard for real-time displays have reported a 20% enhancement in decision-making speed, underscoring the efficacy of these tools in optimizing operational efficiency and strategic planning.
Case studies illustrate that companies utilizing marketing tools have effectively reduced expenses while enhancing revenue impact. This demonstrates the tangible benefits of embracing such technologies. As highlighted by Harvard Business School, effectively utilizing information through an online dashboard is crucial for making high-impact business decisions, further emphasizing the importance of visual displays in today’s data-driven landscape.
Gather and Prepare Relevant Market Data for Your Dashboard
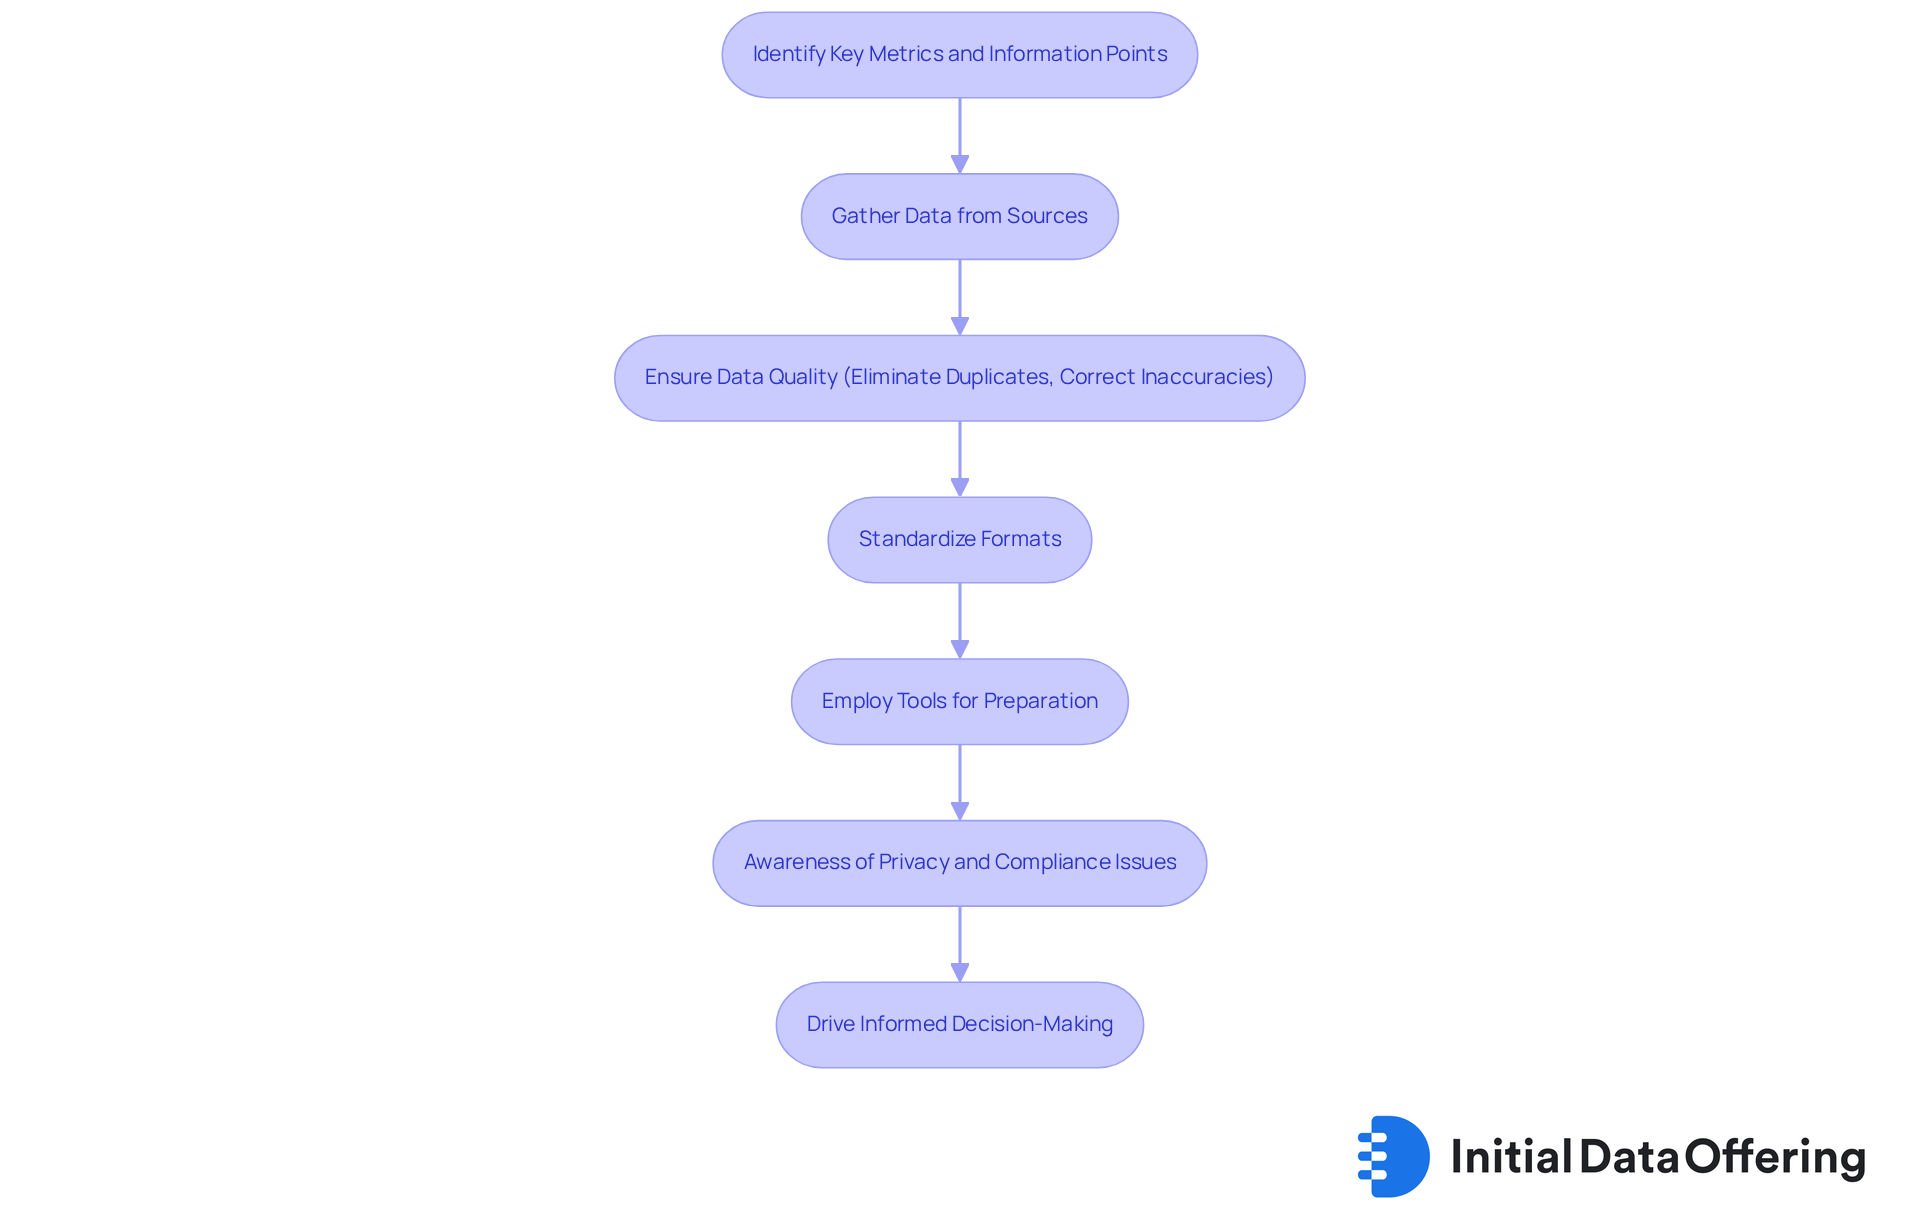
To create an effective online dashboard, it is essential to begin by identifying the key metrics and information points that are crucial for your analysis goals. These data sources can include internal databases, market research reports, and publicly available datasets. Once you’ve pinpointed your information sources, focus on ensuring that the content is clean and well-organized. This process may involve eliminating duplicates, correcting inaccuracies, and standardizing formats.
Employing tools like Excel or specialized software for preparation can significantly simplify this task. By dividing your information, you enable more detailed analysis, which provides a greater understanding of industry trends and consumer behavior. For instance, organizations such as Valona utilize sophisticated information preparation methods to enhance their intelligence capabilities, ensuring that their dashboards display precise and actionable insights.
However, it’s essential to be aware of potential challenges in information preparation, including privacy and compliance issues, which can affect the effectiveness of your analysis. As highlighted by IMARC, "The information preparation market is anticipated to show a CAGR of 16.42% from 2025 to 2033, achieving a worth of USD 27.28 Billion by 2033." This statistic emphasizes the increasing significance of efficient information management in today’s analytics-driven environment.
How can you leverage these insights in your own work? By understanding the importance of data preparation, you can ensure that your dashboards not only present data but also drive informed decision-making.
Choose the Right Dashboard Tool for Your Needs
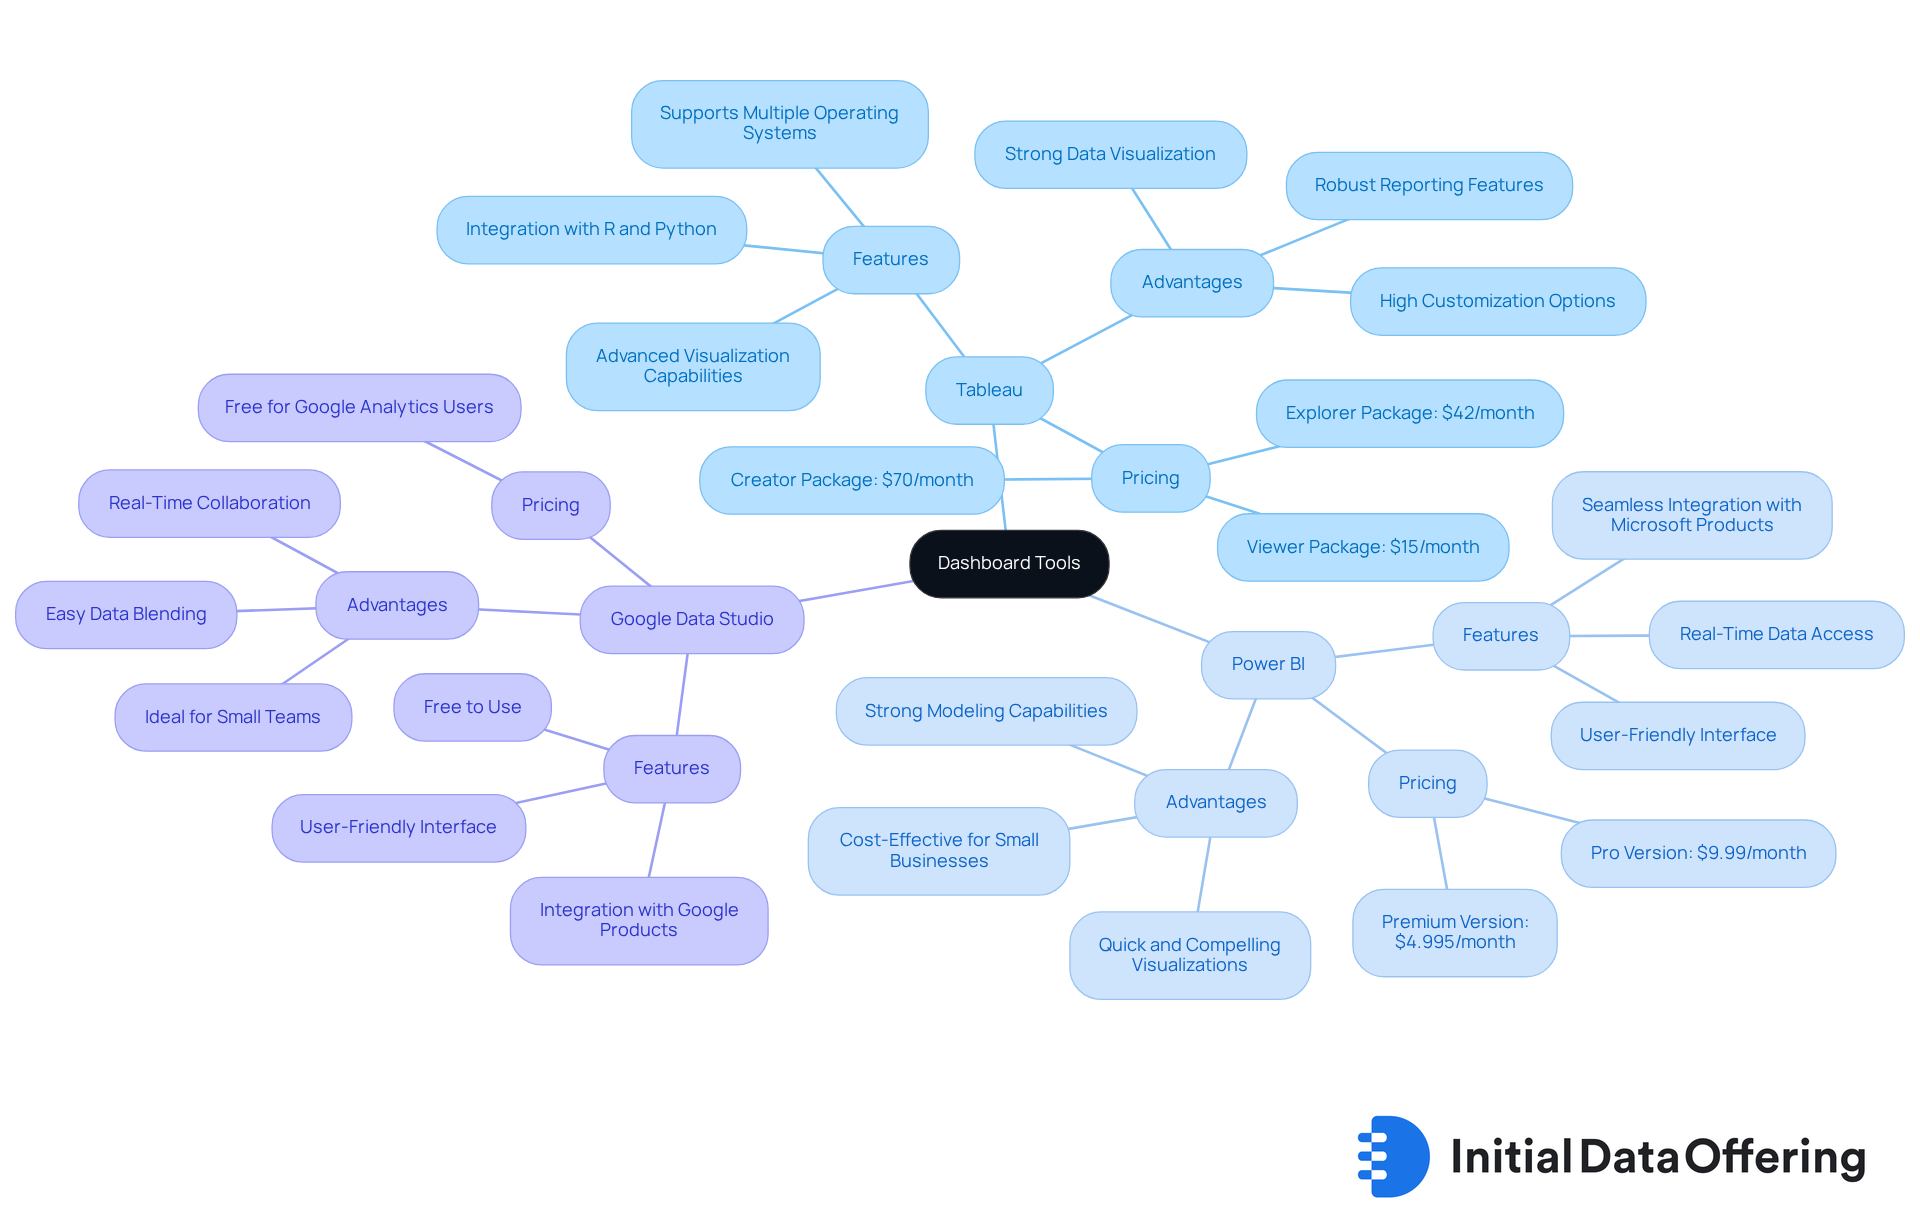
Choosing the right display tool requires a careful evaluation of several key factors, including user-friendliness, integration capabilities, and essential features, all of which can be assessed through an online dashboard tailored to your specific needs. Tableau, Power BI, and Google Data Studio are three popular options, each offering unique advantages.
- Tableau stands out for its advanced visualization capabilities, making it perfect for users who need intricate and visually appealing dashboards. This feature enables deeper insights and more engaging presentations of data via an online dashboard.
- Power BI, on the other hand, integrates seamlessly with Microsoft products, which is particularly beneficial for organizations already using Microsoft tools. This integration enhances productivity and streamlines workflows.
- Lastly, Google Data Studio is a free and user-friendly option, making it especially suitable for individuals or small teams with limited budgets or basic visualization needs.
When assessing these tools, consider your budget, the complexity of your data, and the level of customization that an online dashboard can provide for your analysis. While Tableau offers robust features, it can be costly for smaller teams, with pricing starting at $70 per user per month for the Creator package and $42 for the Explorer package. In contrast, Power BI is more budget-friendly, with a Pro version available for about $9.99 per user each month, making it accessible for startups and small businesses.
User satisfaction data indicates that organizations using an online dashboard like Tableau report significant enhancements in insights-driven decision-making and productivity. A Salesforce survey found that clients utilizing Tableau experienced a 33% increase in insights-driven decisions and a 32% boost in productivity. Meanwhile, Power BI's real-time data access features have made it a preferred choice for users needing immediate insights, with many experts favoring it for its simplicity and cost-effectiveness.
To make an informed decision, take advantage of the online dashboard and the free trials offered by these platforms. Testing their features will help you identify which tool best aligns with your analytical needs and can effectively manage the data volume you intend to analyze. Additionally, ensure that the chosen tool allows for easy sharing of insights with stakeholders, as collaboration is vital for effective market analysis.
Design Your Dashboard for Clarity and Impact
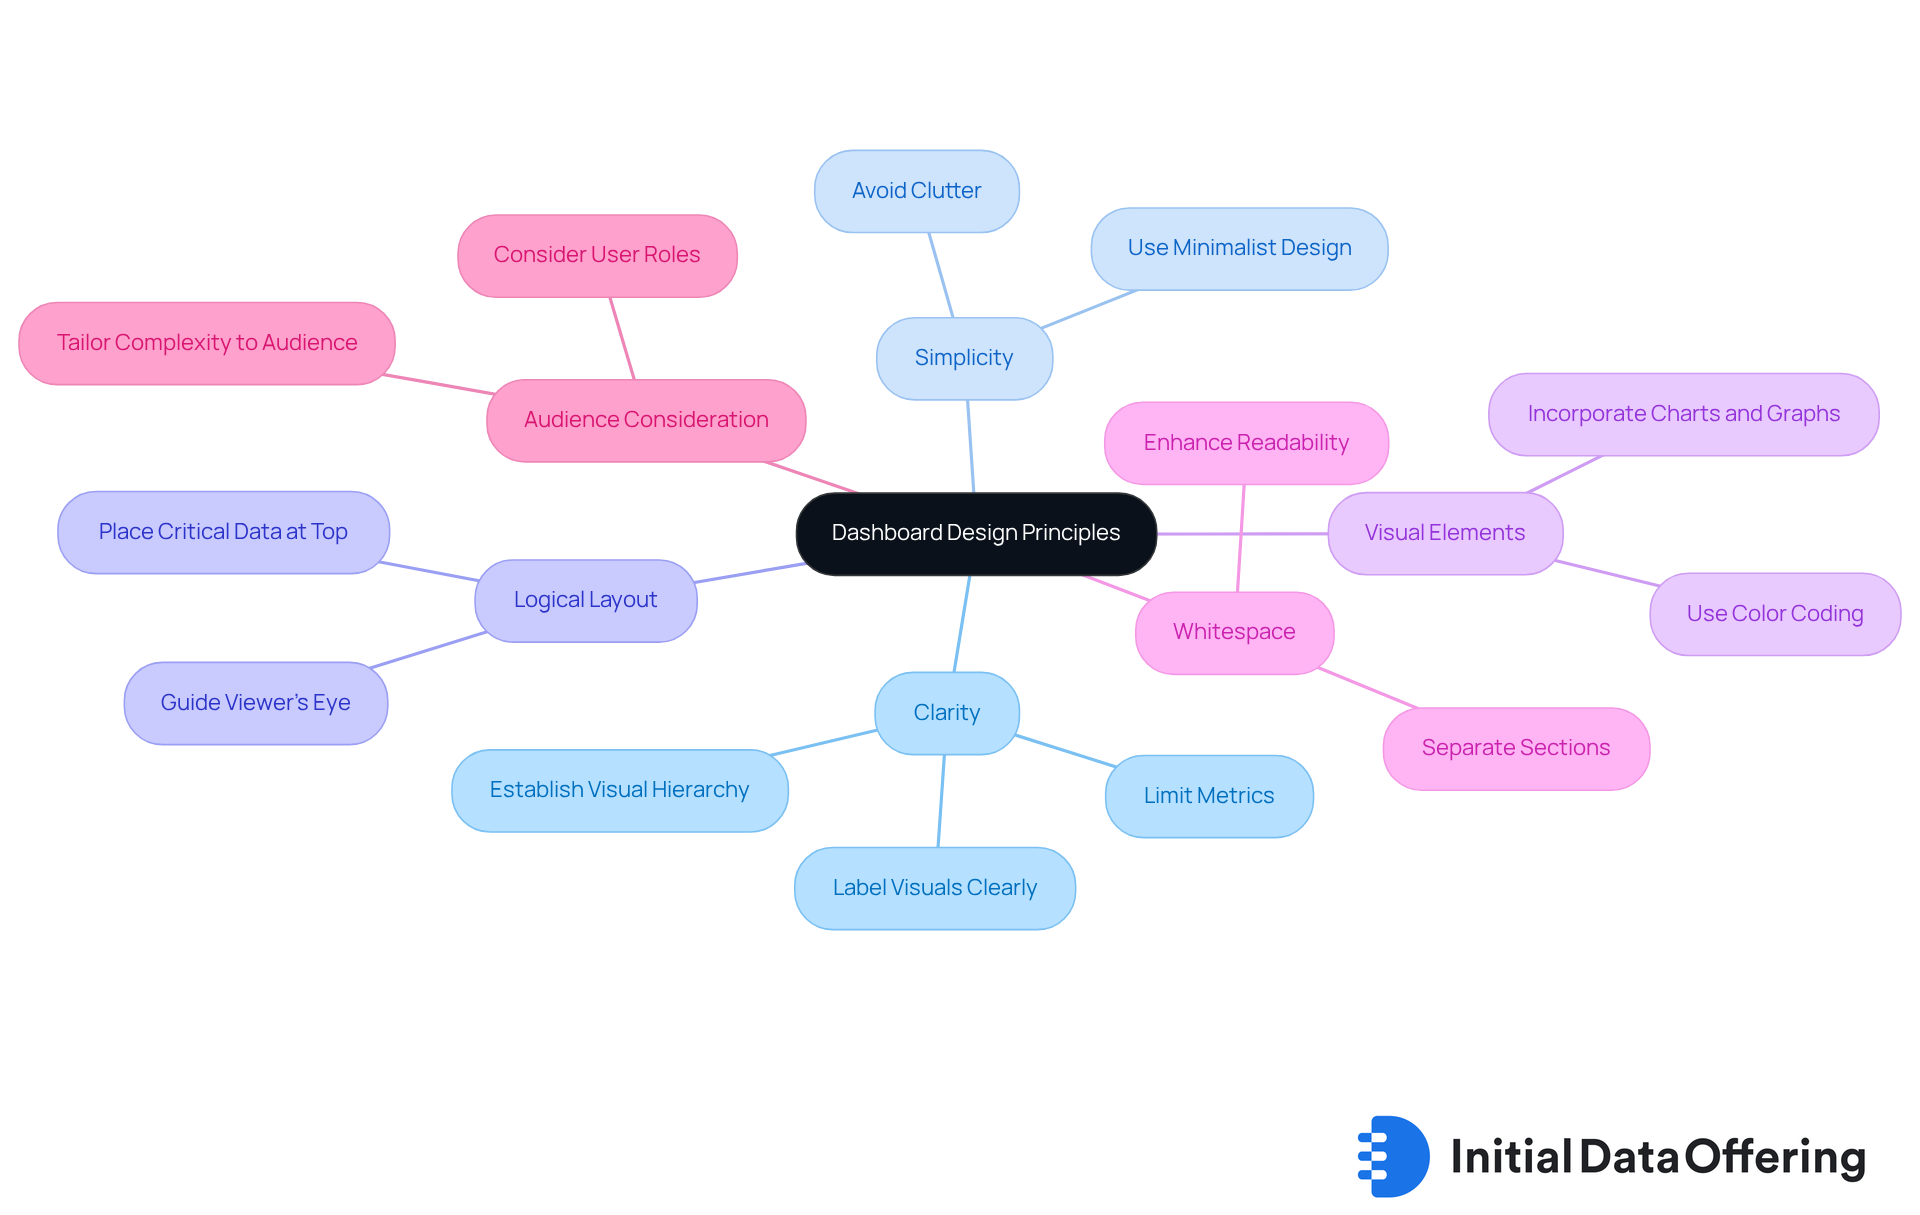
When designing your online dashboard, it's essential to prioritize clarity and simplicity. A logical layout guides the viewer's eye to the most important information first, ensuring that critical data is easily accessible. Incorporating visual elements such as charts, graphs, and color coding enhances understanding, making complex information more digestible.
To avoid clutter, limit the number of metrics displayed at once. Focus on key performance indicators that align with your analysis goals. This approach not only streamlines the information but also highlights what truly matters. Effective use of whitespace separates different sections, enhancing readability and allowing users to process information without feeling overwhelmed.
Furthermore, ensure that all visual representations are labeled clearly. Consider your audience's familiarity with the information; adjusting the complexity of the visuals accordingly can significantly improve comprehension. How might these strategies impact your own data presentations? By implementing these principles, you can create a control panel that not only informs but also engages your audience effectively.
Test and Refine Your Dashboard for Optimal Performance
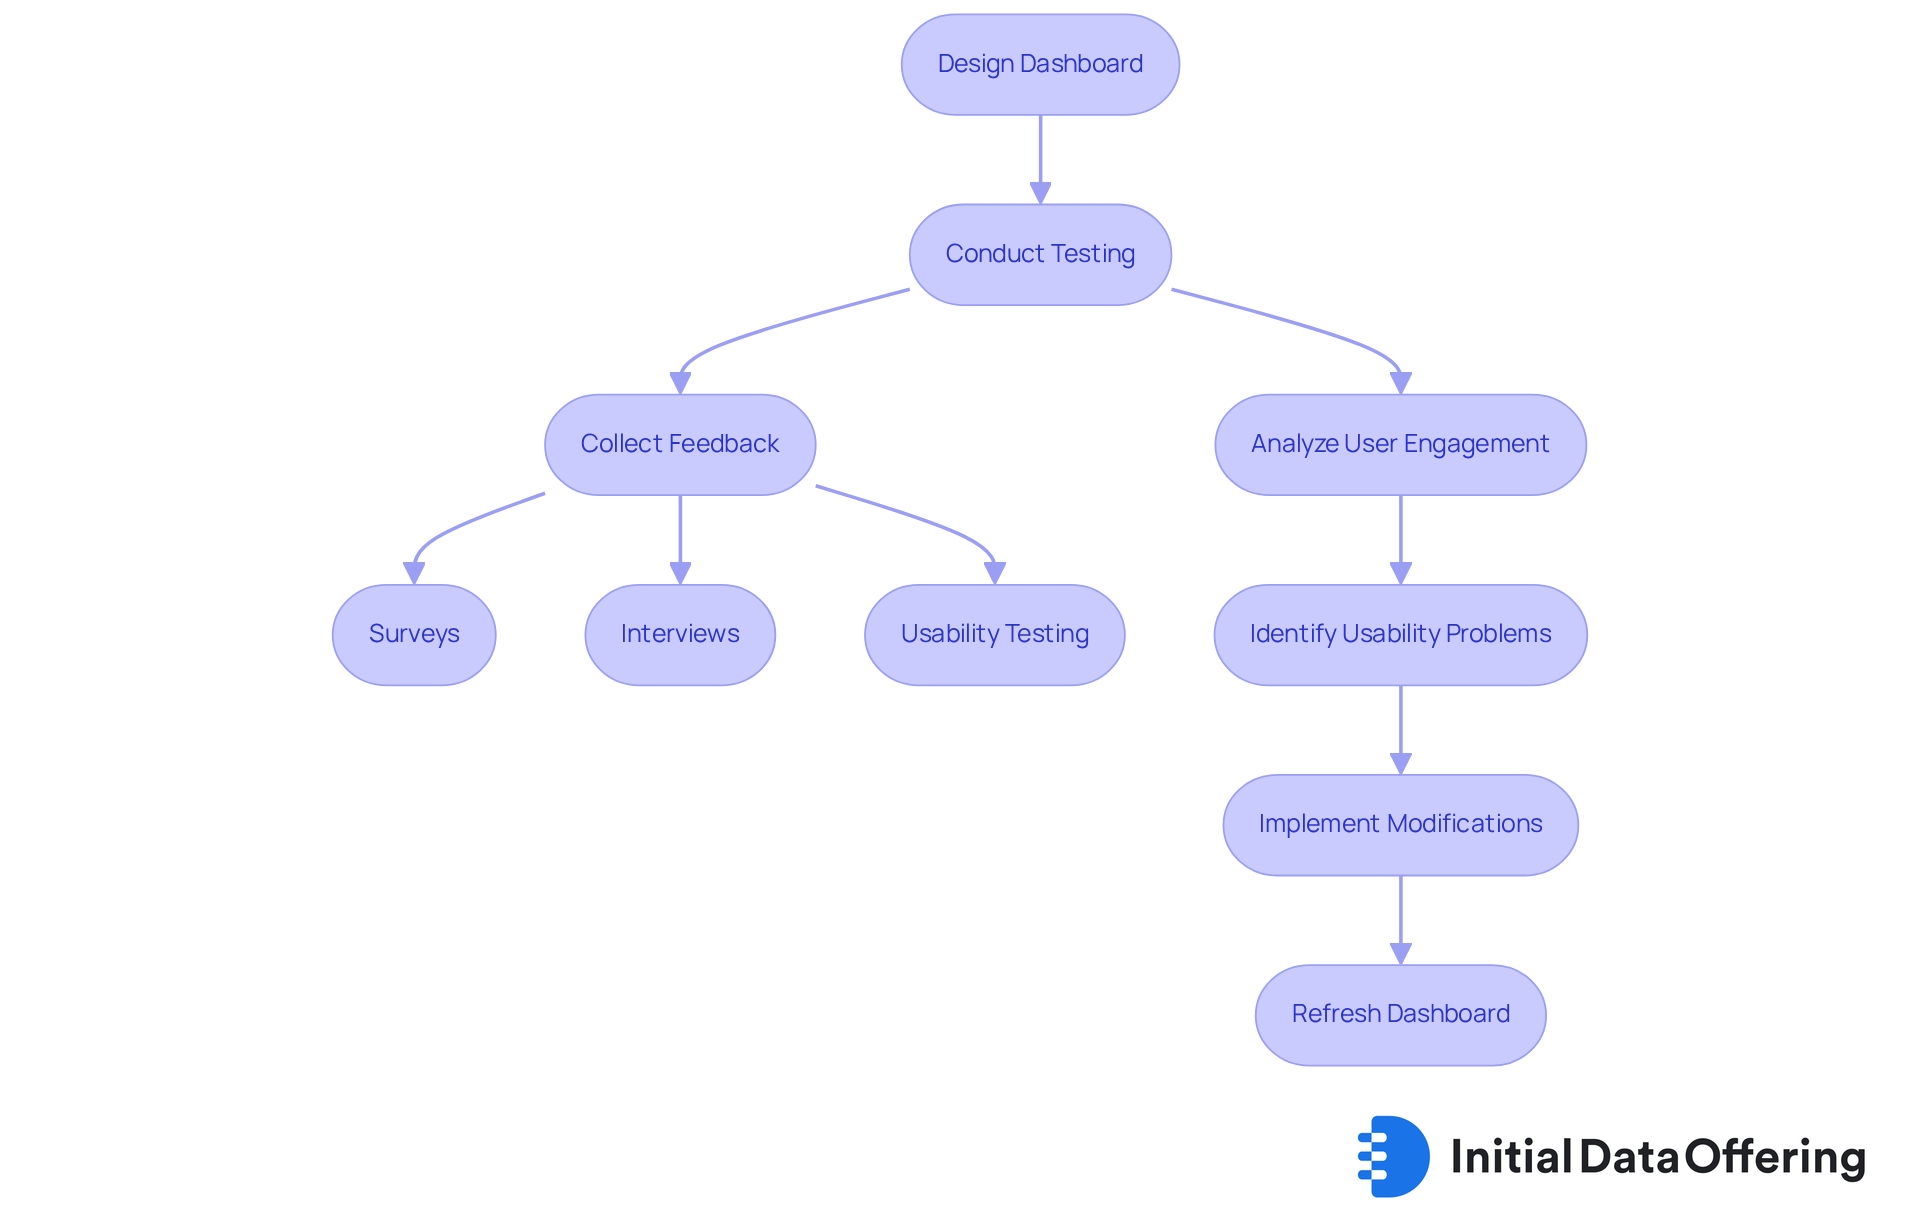
After designing your dashboard, it's crucial to conduct thorough testing to ensure that all data visualizations are accurate and functioning as intended. This process involves collecting feedback from prospective participants through various techniques, such as interviews, surveys, and usability testing. By pinpointing usability problems or areas for enhancement, you can significantly improve the user experience.
Consider the loading times and responsiveness of your dashboard. These factors can greatly affect how users interact with the interface. Utilizing analytical tools allows you to observe user engagement and make modifications based on their actions. Regularly refreshing the interface with new data and enhancing its design according to continuous feedback ensures that it remains relevant and efficient for market analysis.
Organizations that prioritize client feedback in their design process often see enhanced performance and increased satisfaction. In fact, studies indicate that 58% of SaaS clients are willing to pay more for decision-enabling interfaces, and 10% would pay as much as 40-60% more on their license for better insights. By adopting a user-centric approach and soliciting feedback throughout the development process, you can transform your dashboard into a strategic asset that aligns with user needs and business objectives.
How can you ensure that your dashboard meets the evolving needs of your users? By continuously engaging with them and adapting your design, you not only enhance usability but also foster a deeper connection with your audience.
Conclusion
Creating an online dashboard for market analysis is essential for leveraging data to make informed decisions. By integrating real-time metrics and key performance indicators, organizations can uncover valuable insights into market trends and operational performance. This ultimately enhances strategic planning and provides a competitive edge.
Key elements in this process include:
- Defining relevant metrics
- Selecting suitable tools
- Designing for clarity
- Continuously refining the dashboard based on user feedback
These steps streamline data presentation and ensure that the dashboard remains a dynamic resource that adapts to the organization's evolving needs. The significance of user-centric design and effective data preparation cannot be overstated, as they are crucial for maximizing the dashboard's impact.
In a fast-paced business environment, effectively leveraging online dashboards can revolutionize how organizations conduct market analysis. By prioritizing clarity, usability, and adaptability, businesses not only improve their decision-making processes but also cultivate a culture of data-driven insights. How can your organization embrace these strategies to stay ahead of the curve and make impactful decisions that drive success?
Frequently Asked Questions
What are online dashboards and why are they important in market analysis?
Online dashboards are dynamic, interactive tools that compile and display information from various sources, allowing users to track key performance indicators (KPIs) and metrics in real-time. They are crucial for trade evaluation as they provide a clear perspective on complex datasets, enabling companies to make quick, informed decisions.
How do online dashboards enhance data-driven decision-making?
By utilizing online dashboards for visual displays, organizations can improve their data-driven decision-making processes, which is essential for maintaining a competitive advantage in a fast-paced business environment. The scalability of these tools supports business expansion and adapts to evolving market demands.
What features do online dashboards offer for customization?
Online dashboards offer personalization and adaptability in interface design, allowing users to customize visual representations according to their specific KPIs, which enhances usability and effectiveness.
What considerations should be made regarding the audience for online dashboards?
Understanding the audience is crucial, as different user needs—such as those of executives versus data analysts—can significantly influence design choices for the dashboard.
What challenges can arise when using online dashboards?
Challenges include information overload and misrepresentation, which can hinder the effectiveness of data displays.
What impact do online dashboards have on decision-making speed?
Organizations that use online dashboards for real-time displays have reported a 20% enhancement in decision-making speed, highlighting their role in optimizing operational efficiency and strategic planning.
How can companies benefit from utilizing online dashboards according to case studies?
Companies that utilize marketing tools through online dashboards have effectively reduced expenses while enhancing revenue impact, demonstrating the tangible benefits of these technologies.
What initial steps should be taken to create an effective online dashboard?
To create an effective online dashboard, it is essential to identify key metrics and information points relevant to your analysis goals, and to gather data from sources like internal databases and market research reports.
What is the importance of data preparation for online dashboards?
Data preparation is crucial as it involves cleaning and organizing content, which may include eliminating duplicates, correcting inaccuracies, and standardizing formats to ensure that the dashboard displays precise and actionable insights.
What challenges might arise during the information preparation process?
Potential challenges in information preparation include privacy and compliance issues, which can impact the effectiveness of the analysis.
What is the projected growth of the information preparation market?
The information preparation market is anticipated to show a compound annual growth rate (CAGR) of 16.42% from 2025 to 2033, achieving a worth of USD 27.28 billion by 2033, highlighting the increasing significance of efficient information management in analytics.