7 Economic Indicators This Week Every Analyst Should Track

7 Economic Indicators This Week Every Analyst Should Track
Overview
The article titled "7 Economic Indicators This Week Every Analyst Should Track" emphasizes the crucial economic indicators that analysts must monitor to evaluate financial health and market trends. It begins by highlighting the significance of tracking indicators such as:
- GDP growth
- Employment figures
- Industrial production
- Consumer spending
- Inflation rates
- Home sales
- Construction spending
Each of these metrics offers critical insights into the current economic landscape. By understanding these indicators, analysts can make informed strategic decisions that impact their organizations.
Why are these indicators so vital? GDP growth reflects the overall economic performance, while employment figures provide insights into job market health. Industrial production and consumer spending reveal the strength of manufacturing and consumer confidence, respectively. Inflation rates indicate price stability, and home sales along with construction spending highlight trends in the real estate market. Together, these datasets form a comprehensive picture of economic conditions.
In conclusion, monitoring these indicators not only enhances analysts' understanding of the economy but also equips them with the knowledge to anticipate market changes. This proactive approach can lead to better decision-making and strategic planning in a rapidly evolving financial environment.
Introduction
Economic indicators serve as the pulse of the financial landscape, guiding analysts through the complexities of market trends and consumer behavior. This week, we focus on seven critical economic indicators that emerge as essential tools for understanding the current economic climate and making informed decisions. As analysts sift through this data, they face the challenge of deciphering how these indicators interact and influence one another.
What insights can we glean from monitoring these metrics? How might they shape future economic forecasts? By examining these questions, we can better appreciate the intricate relationships within economic data.
Initial Data Offering: Access Comprehensive Economic Datasets
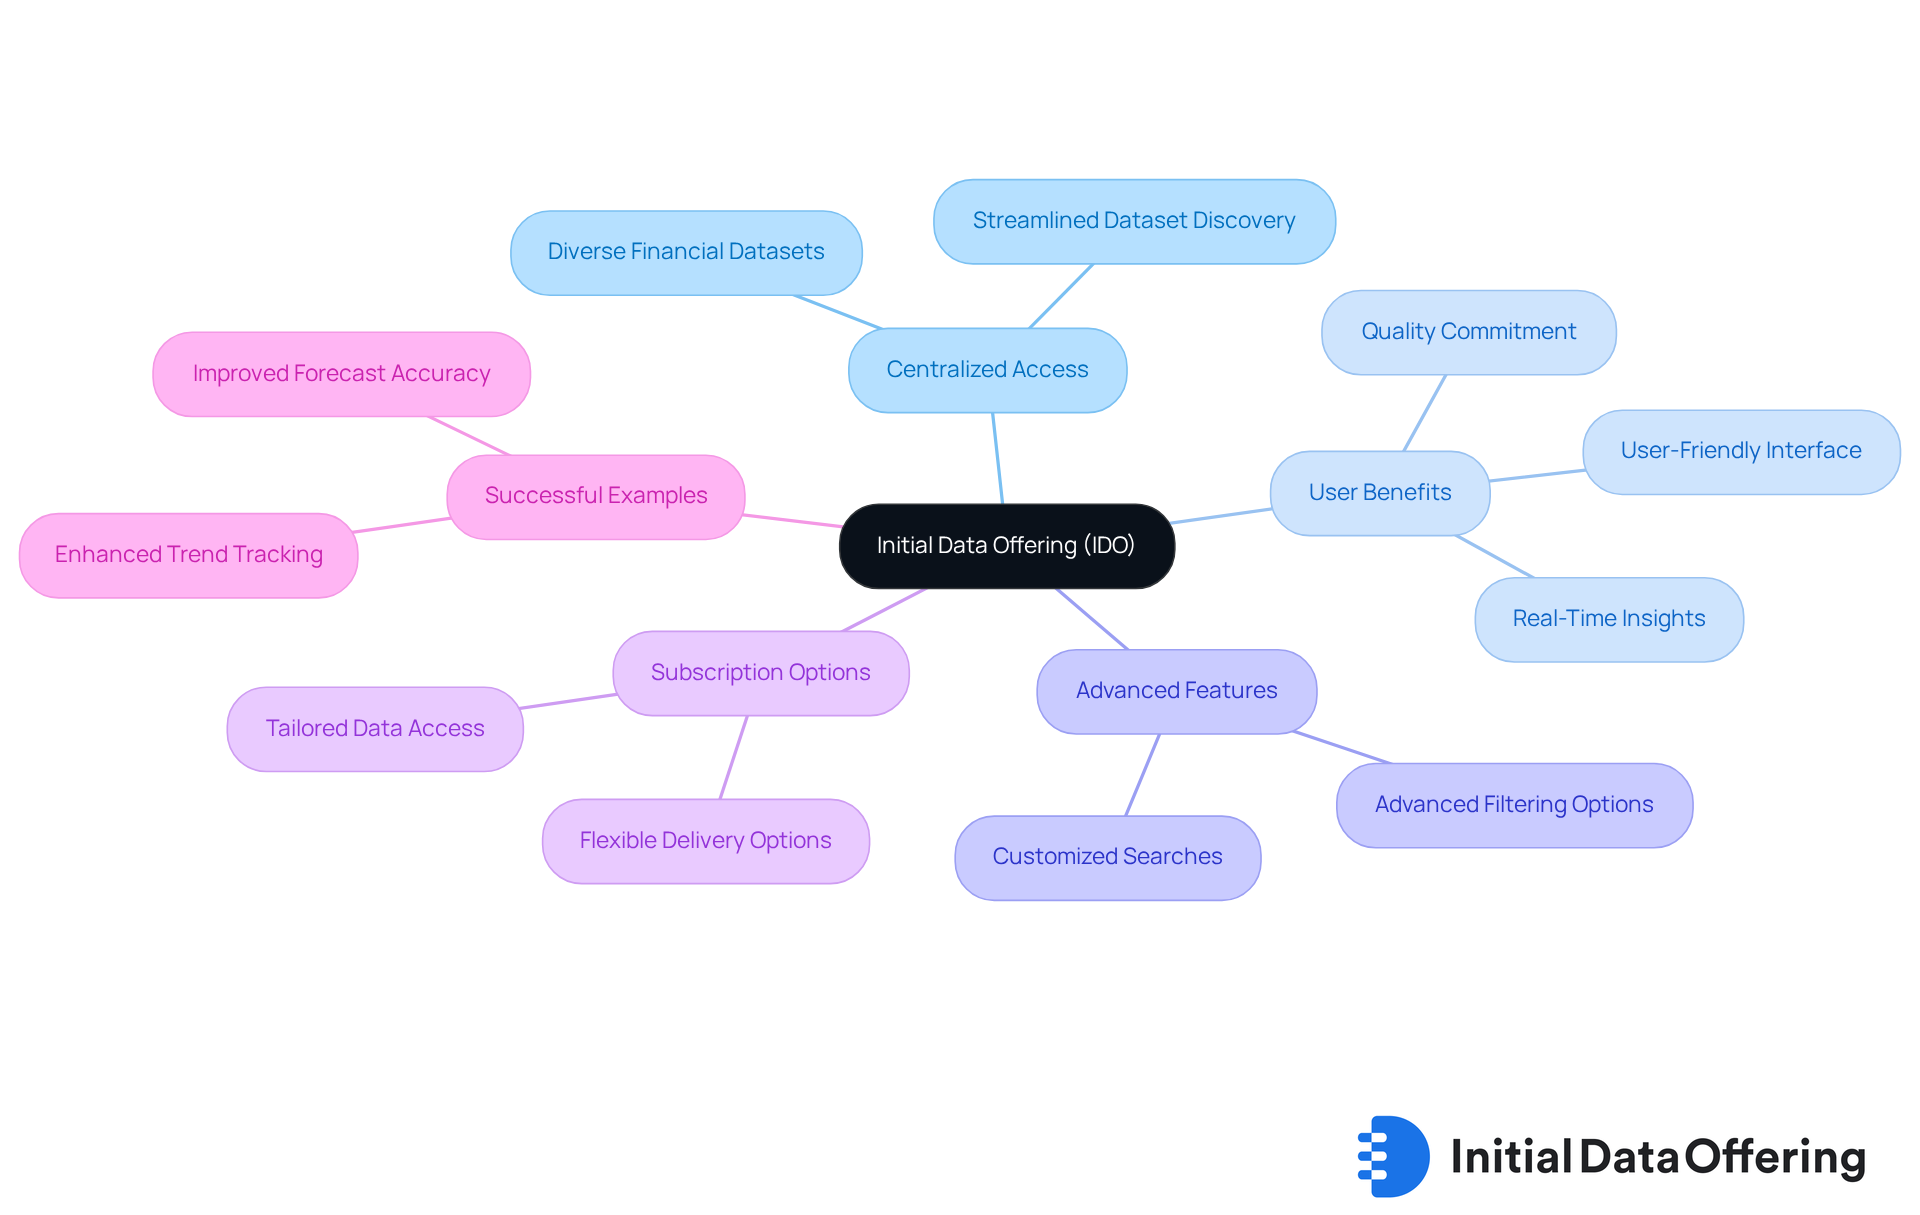
The Initial Data Offering (IDO) acts as a centralized hub for accessing a diverse range of financial datasets, establishing itself as an essential resource for market research analysts. By streamlining the process of launching and discovering new datasets, IDO enables analysts to effortlessly find the information necessary to effectively monitor financial indicators. The platform offers datasets across various sectors, including finance, social media, and environmental studies, ensuring users have access to high-quality and unique datasets that can inform their analyses and decision-making processes.
Recent trends indicate a growing demand for organized financial datasets, particularly those that provide real-time insights into economic indicators this week. Analysts benefit from IDO's commitment to quality, with new datasets added daily, which helps them stay informed about economic indicators this week. The platform's user-friendly interface promotes easy navigation and discovery, empowering analysts to make informed decisions based on reliable data.
To maximize the advantages of IDO, analysts are encouraged to explore the platform's advanced filtering features, which enable customized searches based on specific financial indicators or sectors. This functionality enhances the ability to swiftly locate relevant datasets, thereby streamlining the research process.
Additionally, IDO's flexible subscription options allow users to tailor their data access, ensuring they receive the most pertinent datasets for their specific analyses. This adaptability is vital in a rapidly evolving financial landscape, where timely data can significantly impact strategic planning and forecasting.
Successful examples of data marketplaces underscore the importance of accessible economic indicators this week. Analysts have observed that platforms like IDO not only enhance their capacity to track trends but also improve the accuracy of their forecasts. By leveraging IDO's extensive datasets, analysts can gain a deeper understanding of financial conditions, ultimately leading to better outcomes for their organizations. Subscribe today to gain exclusive access to high-quality datasets and stay ahead in your market analysis.
Gross Domestic Product (GDP): Key Measure of Economic Activity
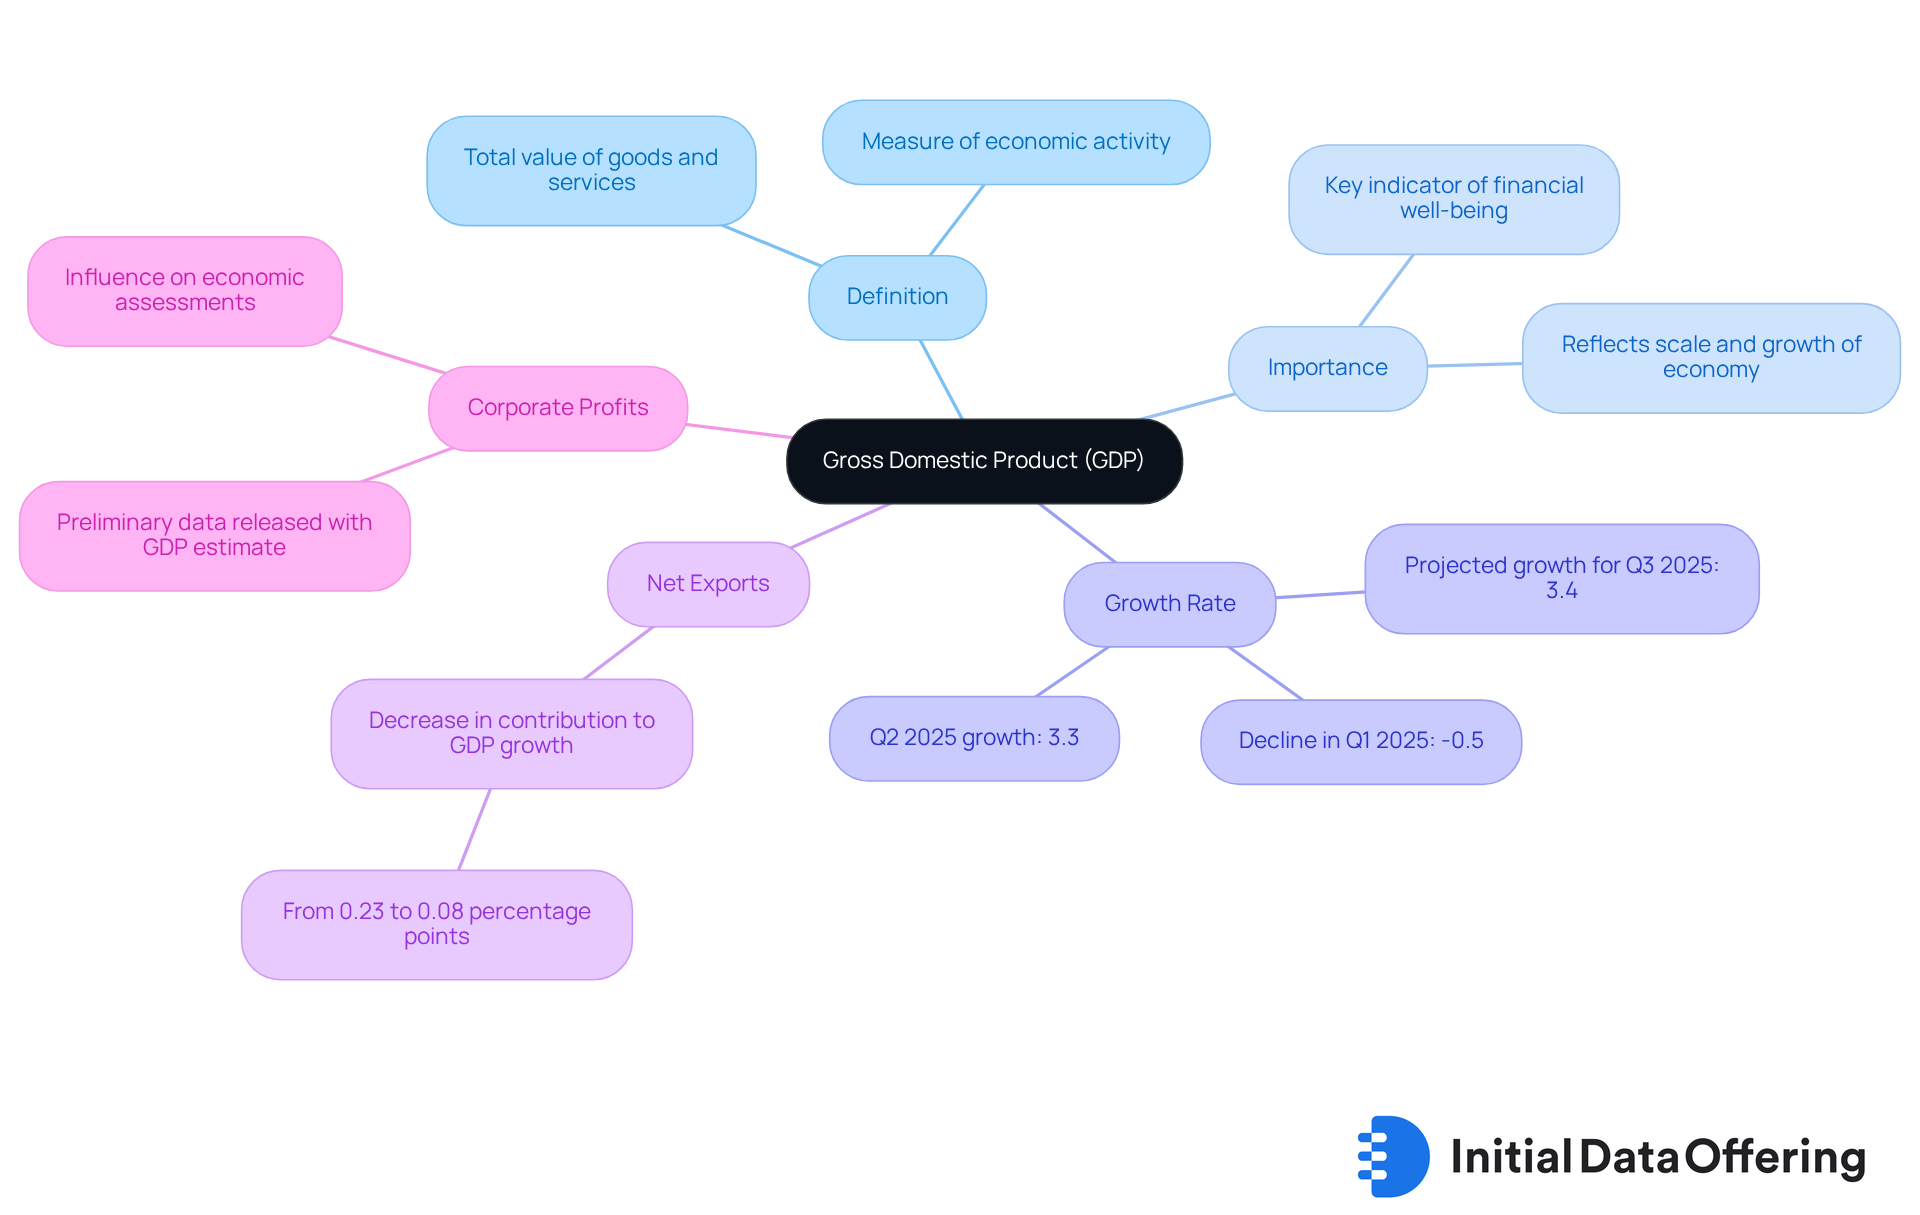
Gross Domestic Product (GDP) represents the total value of all goods and services produced over a specific time period within a country. This measure is a key indicator of financial well-being, reflecting both the scale and growth of the economy. Analysts should closely monitor GDP growth figures, which are frequently published quarterly, as they are essential for assessing financial performance. For instance, the GDPNow model from the Federal Reserve Bank of Atlanta recently projected a growth rate of 3.4% for Q3 2025. This projection suggests a robust recovery following a decline of 0.5% in Q1 2025, underscoring the significance of the rebound in economic activity.
Moreover, the contribution of net exports to GDP growth has decreased from 0.23 percentage points to 0.08 percentage points. This shift highlights the various factors influencing changes in GDP. Additionally, information regarding corporate profits has been released alongside the GDP estimate, providing a more comprehensive view of the financial landscape. How do these shifts in GDP and corporate profits inform your understanding of the market?
As noted by economist Lisa Mataloni, GDP serves as a comprehensive measure of U.S. economic activity. Therefore, it is crucial for analysts to stay informed about the latest estimates. The next GDPNow update is scheduled for September 17, 2025, ensuring that analysts have access to the most current data as they navigate the dynamic market landscape. Staying updated will empower analysts to make informed decisions based on the evolving economic context.
Employment Figures: Insights into Labor Market Dynamics
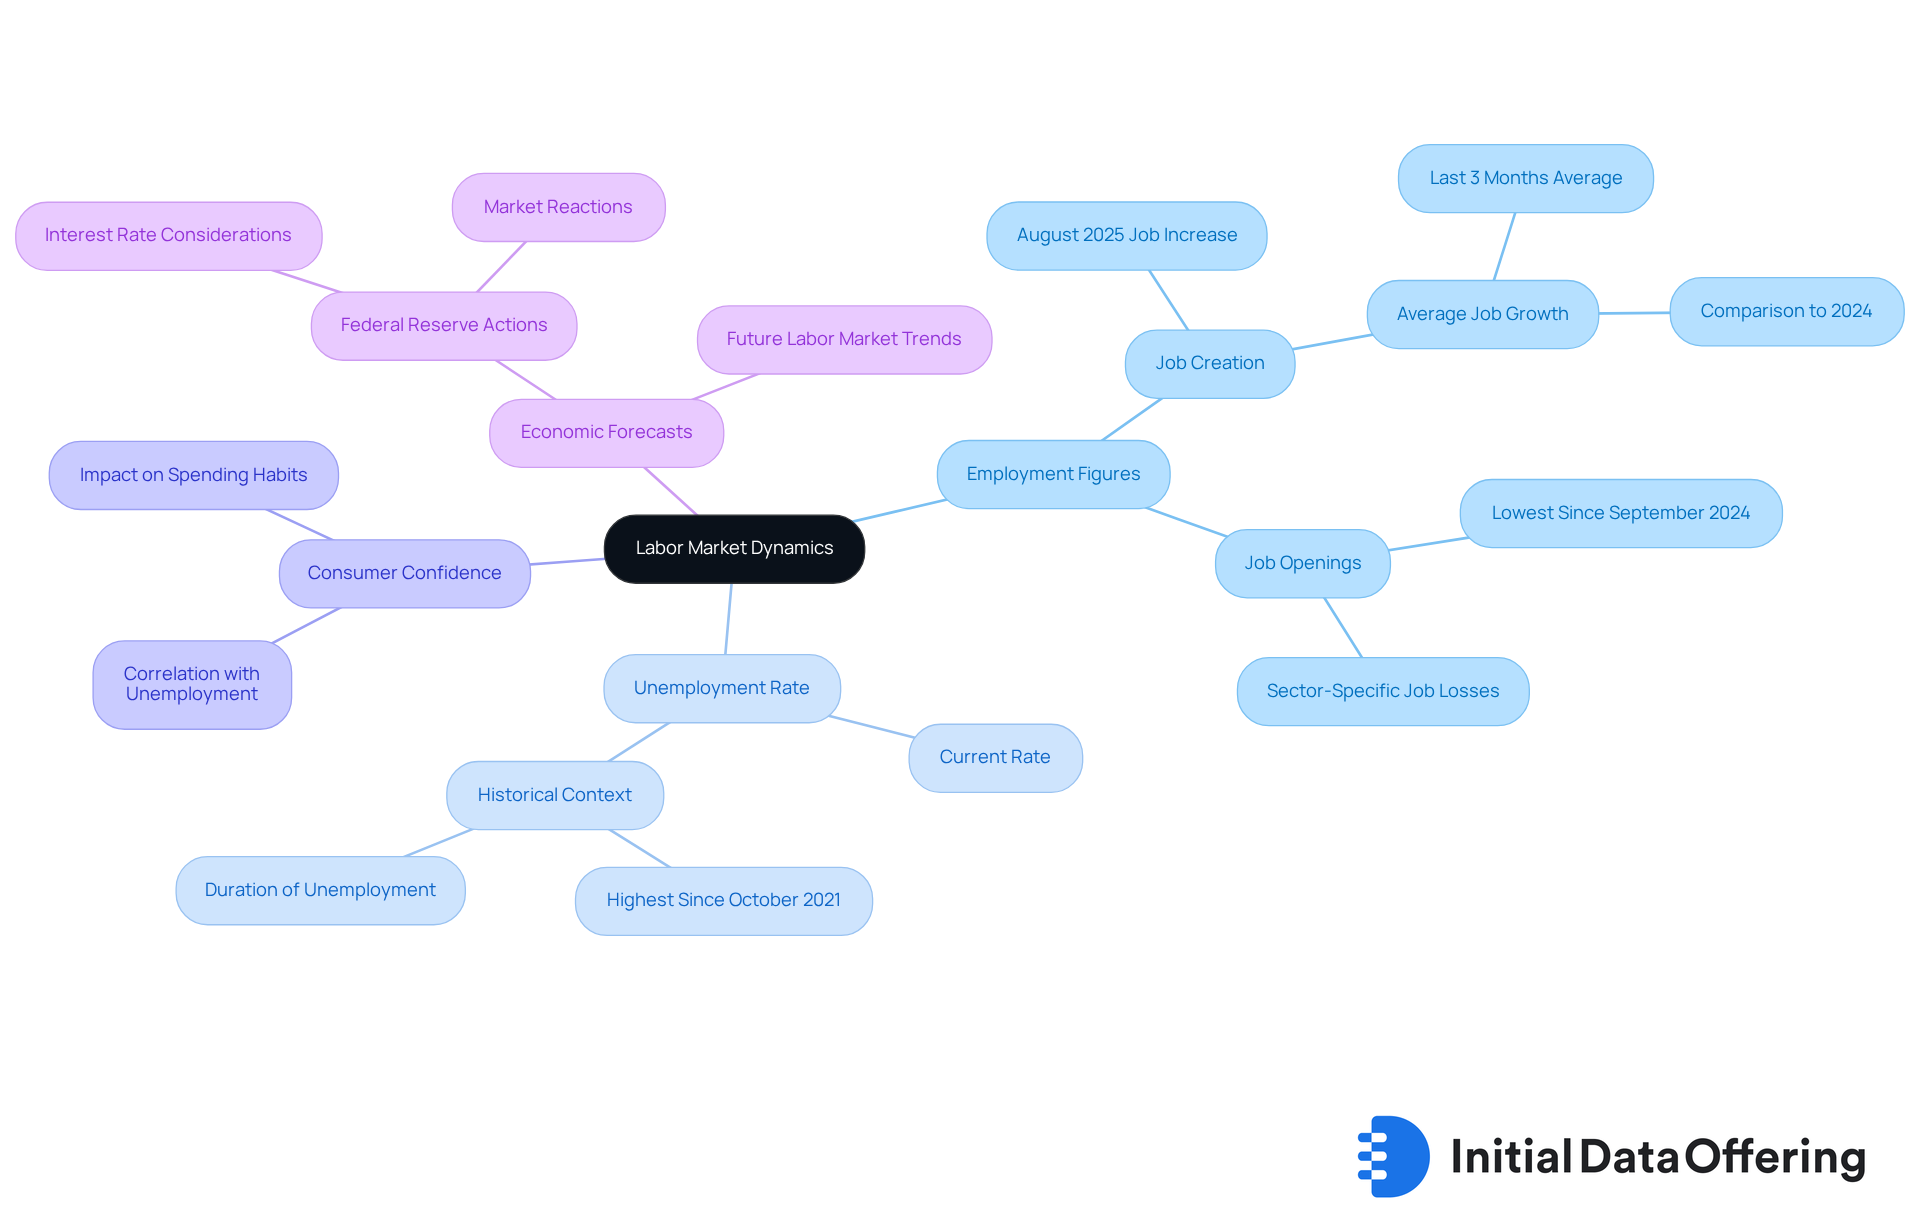
Employment figures, particularly the unemployment level and job creation statistics, are critical for analyzing labor market dynamics. In August 2025, the Bureau of Labor Statistics reported a modest increase of just 22,000 jobs. Concurrently, the unemployment rate rose to 4.3%, marking the highest level since October 2021. This rise in unemployment, coupled with a significant decline in job openings—the lowest since September 2024—signals fundamental weaknesses in the labor market. Such trends could undermine public confidence and alter spending habits.
Economists emphasize that increasing unemployment rates often correlate with diminished consumer confidence. When individuals feel less secure in their financial situations, they tend to spend less, which is vital for economic growth. Analysts frequently rely on unemployment data as one of the economic indicators this week for financial forecasting, as it acts as a leading indicator of financial health. For instance, the current trend of job creation averaging only 29,000 per month over the past three months—down from 82,000 in the same period of 2024—raises concerns about future financial performance.
Looking ahead to September 2025, the labor market's direction remains uncertain. The Federal Reserve is expected to consider a quarter-percentage-point reduction in response to these labor market challenges. The effects of this decision on consumer behavior and overall financial activity will be closely monitored. As analysts observe these developments, the interplay between unemployment rates and consumer confidence will be vital in shaping financial forecasts, particularly in light of the economic indicators this week.
Industrial Production: Gauge of Manufacturing Sector Health
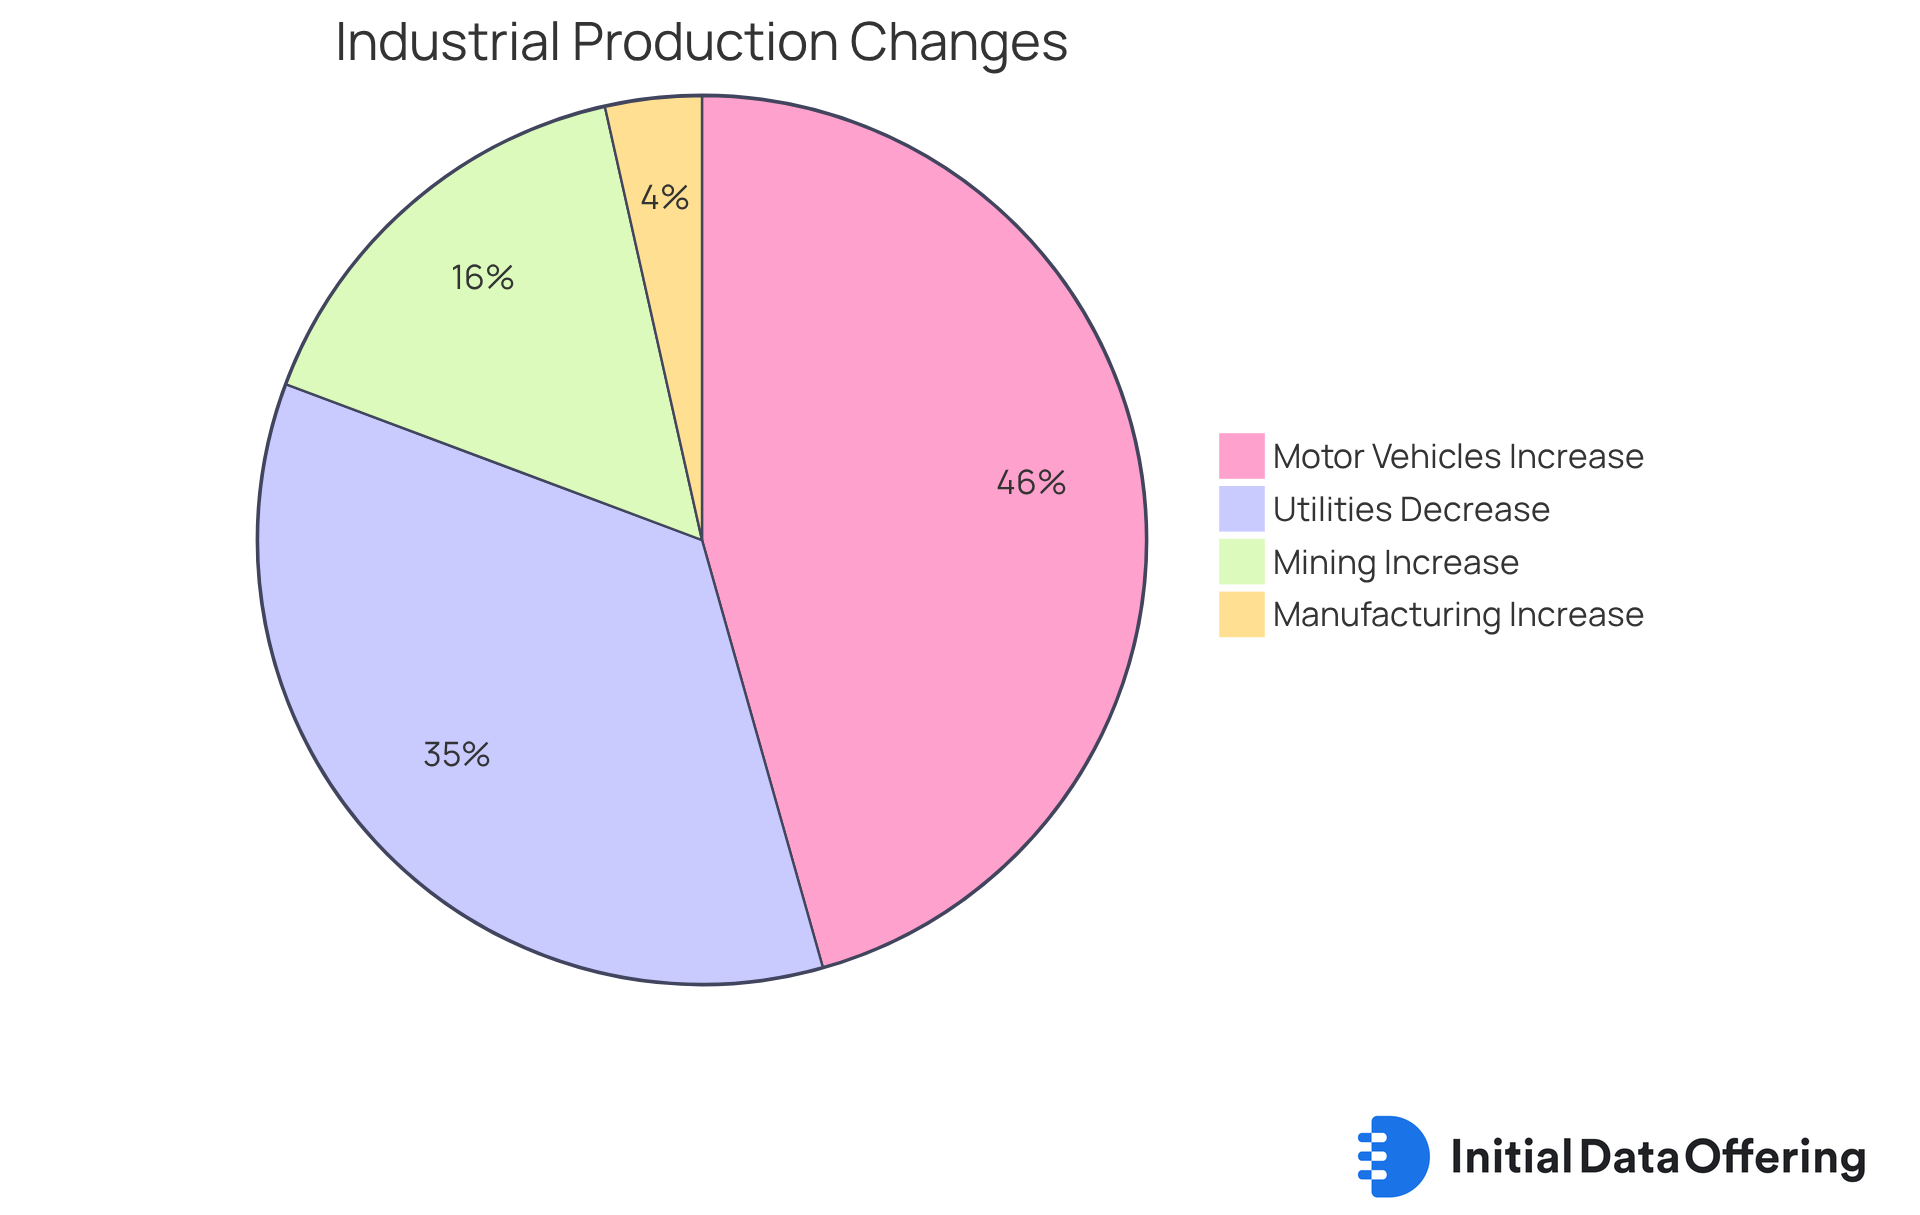
Industrial production measures the output of the manufacturing, mining, and utilities sectors, acting as a vital indicator of financial health. In August 2025, industrial production saw a significant year-on-year increase of 0.9%. This uptick suggests a resurgence in manufacturing activity, a development that was unexpected given the prior decline of 0.4% in July. Analysts should closely monitor these trends, as they provide insights into the capacity and efficiency of the manufacturing sector, crucial for forecasting future financial conditions.
Capacity utilization, another essential indicator, held steady at 77.4% in August, reflecting stable operational levels within the industrial sector. Manufacturing output increased by 0.2% during this period, bolstered by an impressive 2.6% rise in the production of motor vehicles and parts. In contrast, utilities output decreased by 2.0% in August, providing additional context to the industrial sector's overall performance. Furthermore, the rebound in manufacturing is supported by a 0.9% increase in mining output, which achieved 90.6% capacity utilization after a previous decline.
Historically, fluctuations in industrial production have been closely tied to broader financial cycles. For instance, during the Great Financial Crisis, the Federal Reserve implemented quantitative easing to stimulate production and restore market stability. Current trends indicate that the manufacturing sector is on a recovery trajectory, making it imperative for analysts to utilize industrial production data in their evaluations.
The real-world implications of this data are evident in market responses to financial reports, where positive surprises in production figures often align with bullish market sentiment. Therefore, understanding the nuances of industrial production trends is crucial for analysts aiming to navigate the complexities of the financial landscape.
Consumer Spending: Indicator of Economic Confidence
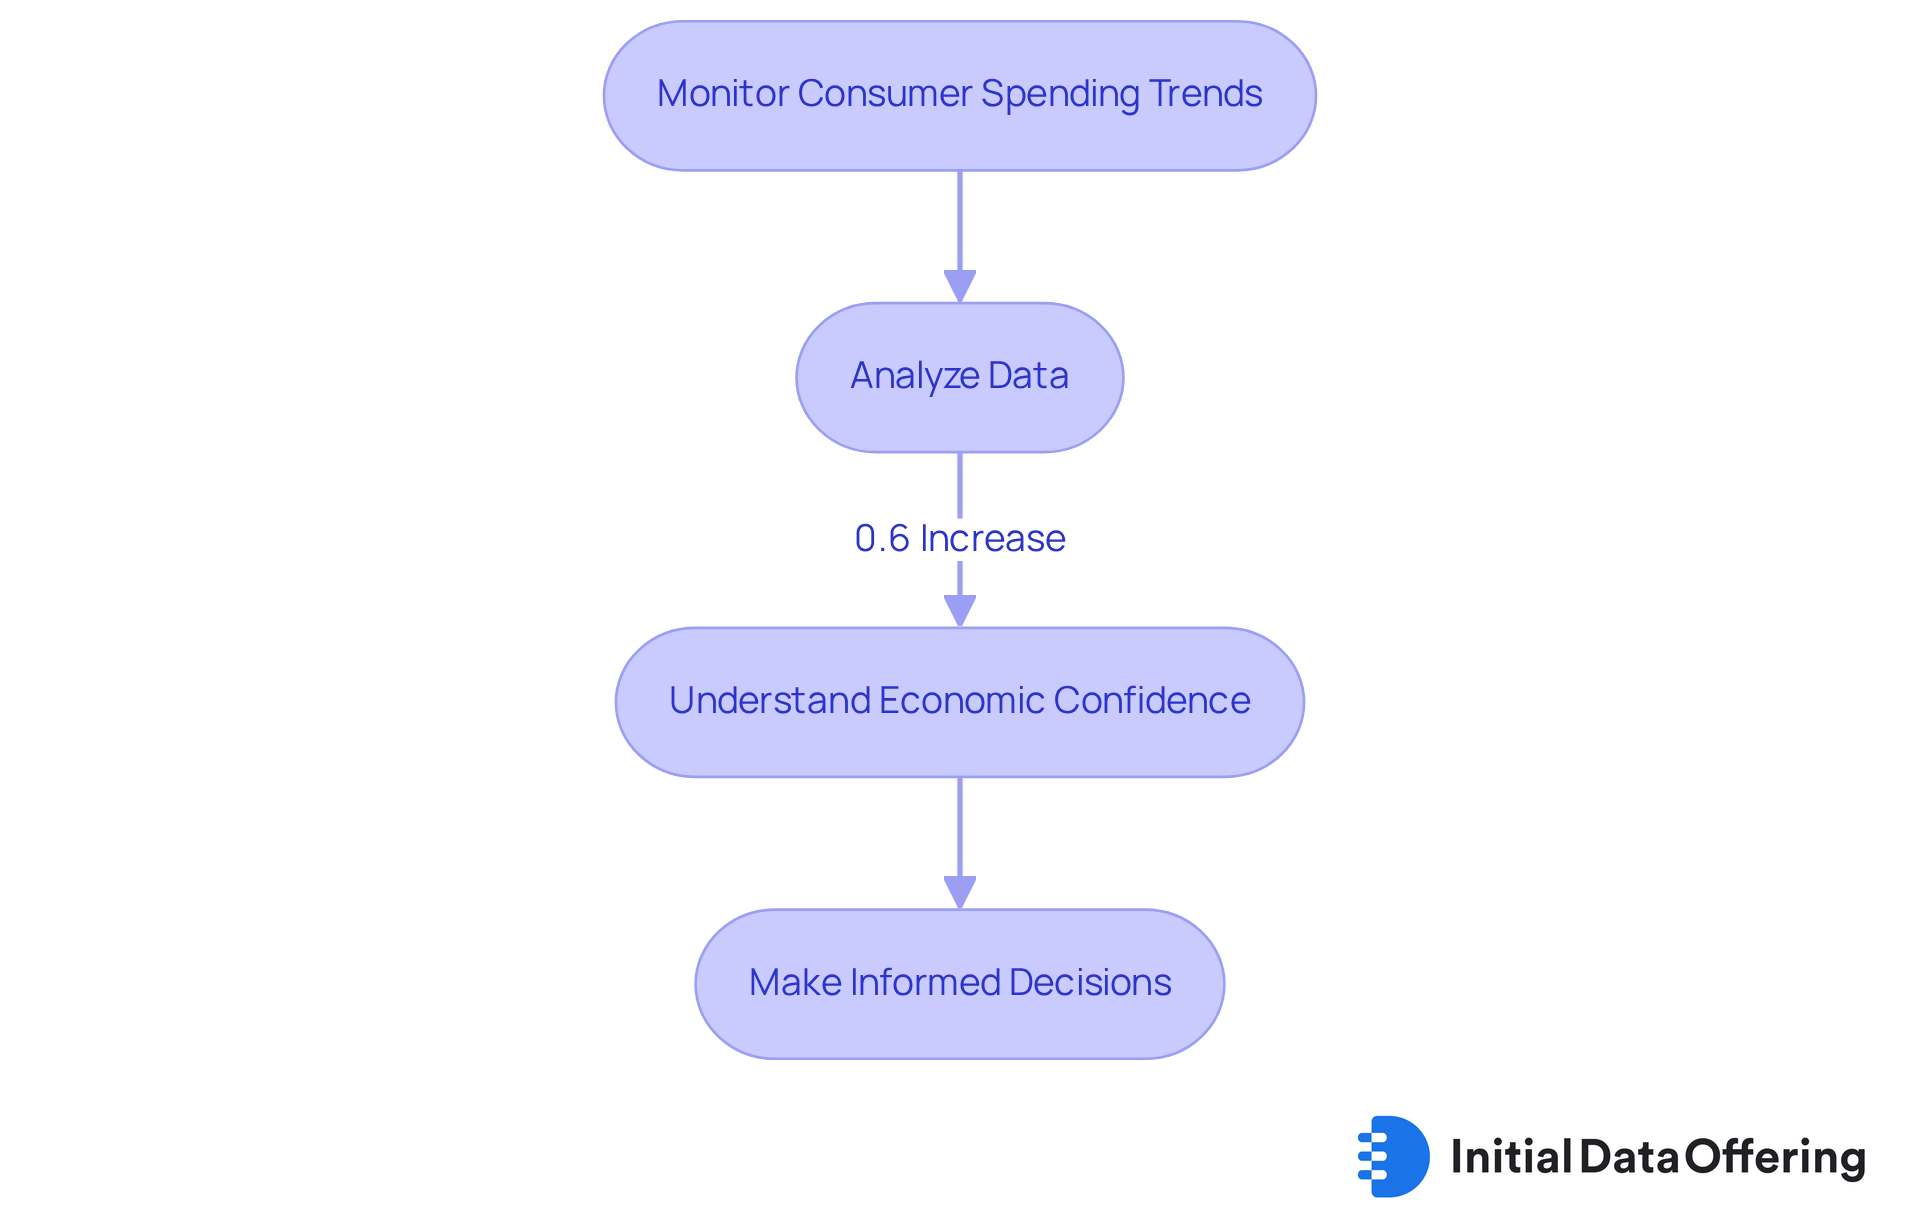
Consumer spending is a vital component of financial activity, serving as a key indicator of economic confidence. In August 2025, retail sales experienced a notable increase of 0.6%. This rise indicates resilience among consumers, even amidst ongoing financial uncertainties. Analysts should closely observe these trends this week, as fluctuations in consumer spending can foreshadow broader economic indicators this week. Understanding these patterns is essential for making informed decisions in a changing economic landscape.
Inflation Rate: Measure of Price Stability
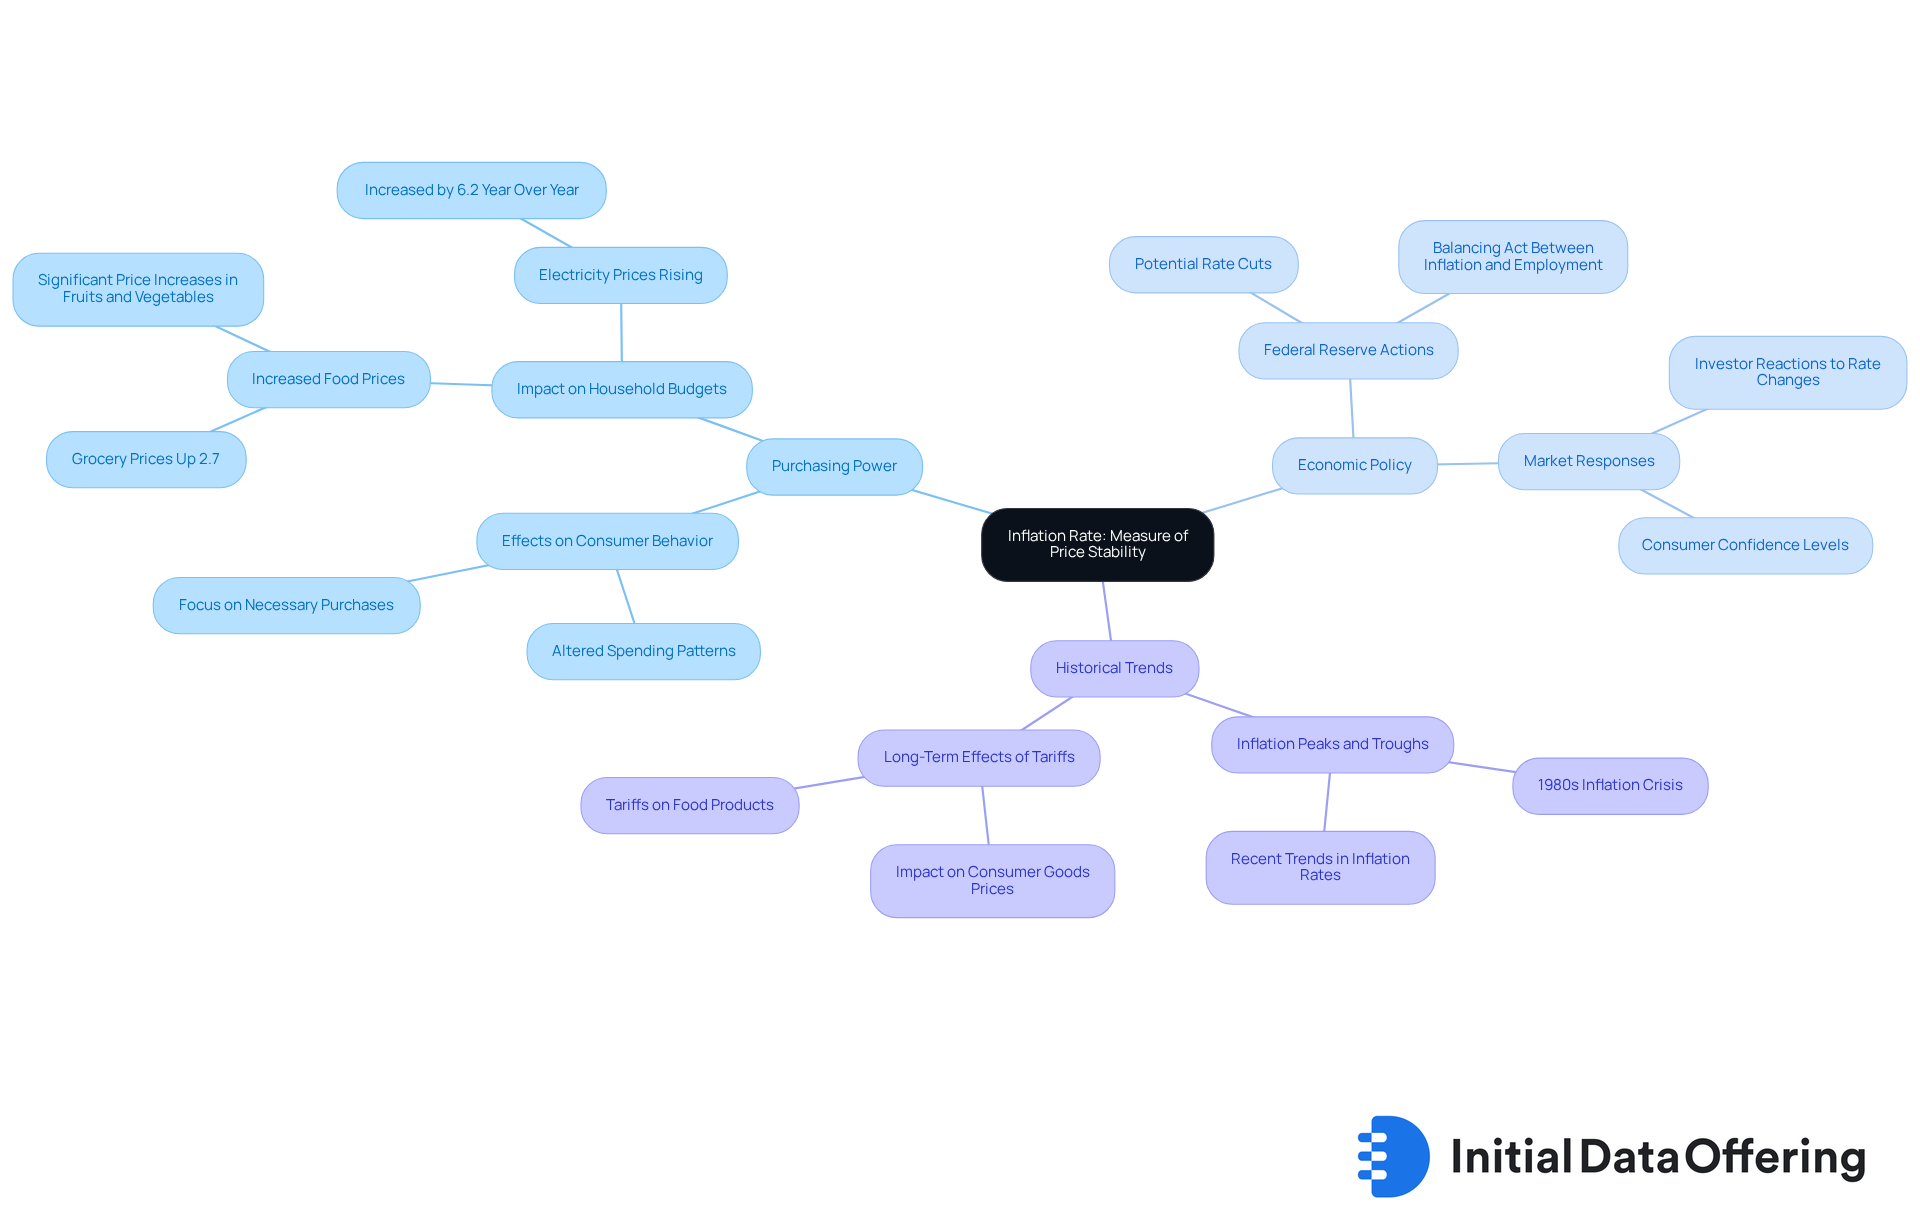
The inflation measure serves as a critical indicator of the overall price level for goods and services, directly influencing purchasing power. As of August 2025, the inflation level stood at 2.9%, indicating ongoing price pressures within the economy. This figure is significant, reflecting a notable increase from previous months, where inflation was recorded at 2.2% in July. Such trends necessitate careful observation by analysts, as increasing inflation can lead to changes in monetary policy, particularly from the Federal Reserve, which may contemplate adjustments to stabilize the economy.
Historically, inflation levels have varied, with the U.S. encountering different peaks and troughs. For instance, the inflation index reached its highest levels in the early 1980s, prompting aggressive interest rate increases to curb inflationary pressures. At present, the Federal Reserve faces a sensitive balancing act; while a slight reduction could enhance public confidence and support the labor market, it risks worsening inflation if not handled carefully. Economists have expressed doubt regarding the effectiveness of such a quarter-point rate reduction in alleviating public concerns about rising prices.
The effects of inflation extend beyond mere numbers, significantly influencing buyer purchasing power. As prices increase, individuals find their capacity to purchase goods and services diminished, leading to alterations in spending behaviors. For example, grocery prices surged by 2.7% in August compared to the previous year, marking the fastest annual pace since August 2023. This rise in food expenses may cause buyers to focus on necessary purchases rather than optional spending, thus altering market dynamics. Additionally, the impact of tariffs on food prices has been significant, contributing to the overall inflationary pressures.
Expert insights indicate that inflation's effect on purchasing power is substantial, with economists cautioning that prolonged inflation could result in entrenched price hikes, further straining household budgets. As noted by economist Zandi, the best course may be to cut rates to keep the economy from falling apart, but this approach carries the risk of inflation becoming more entrenched. As inflation continues to evolve, analysts must stay alert, monitoring these indicators to predict changes in buying patterns and broader economic trends.
Home Sales: Indicator of Real Estate Market Activity
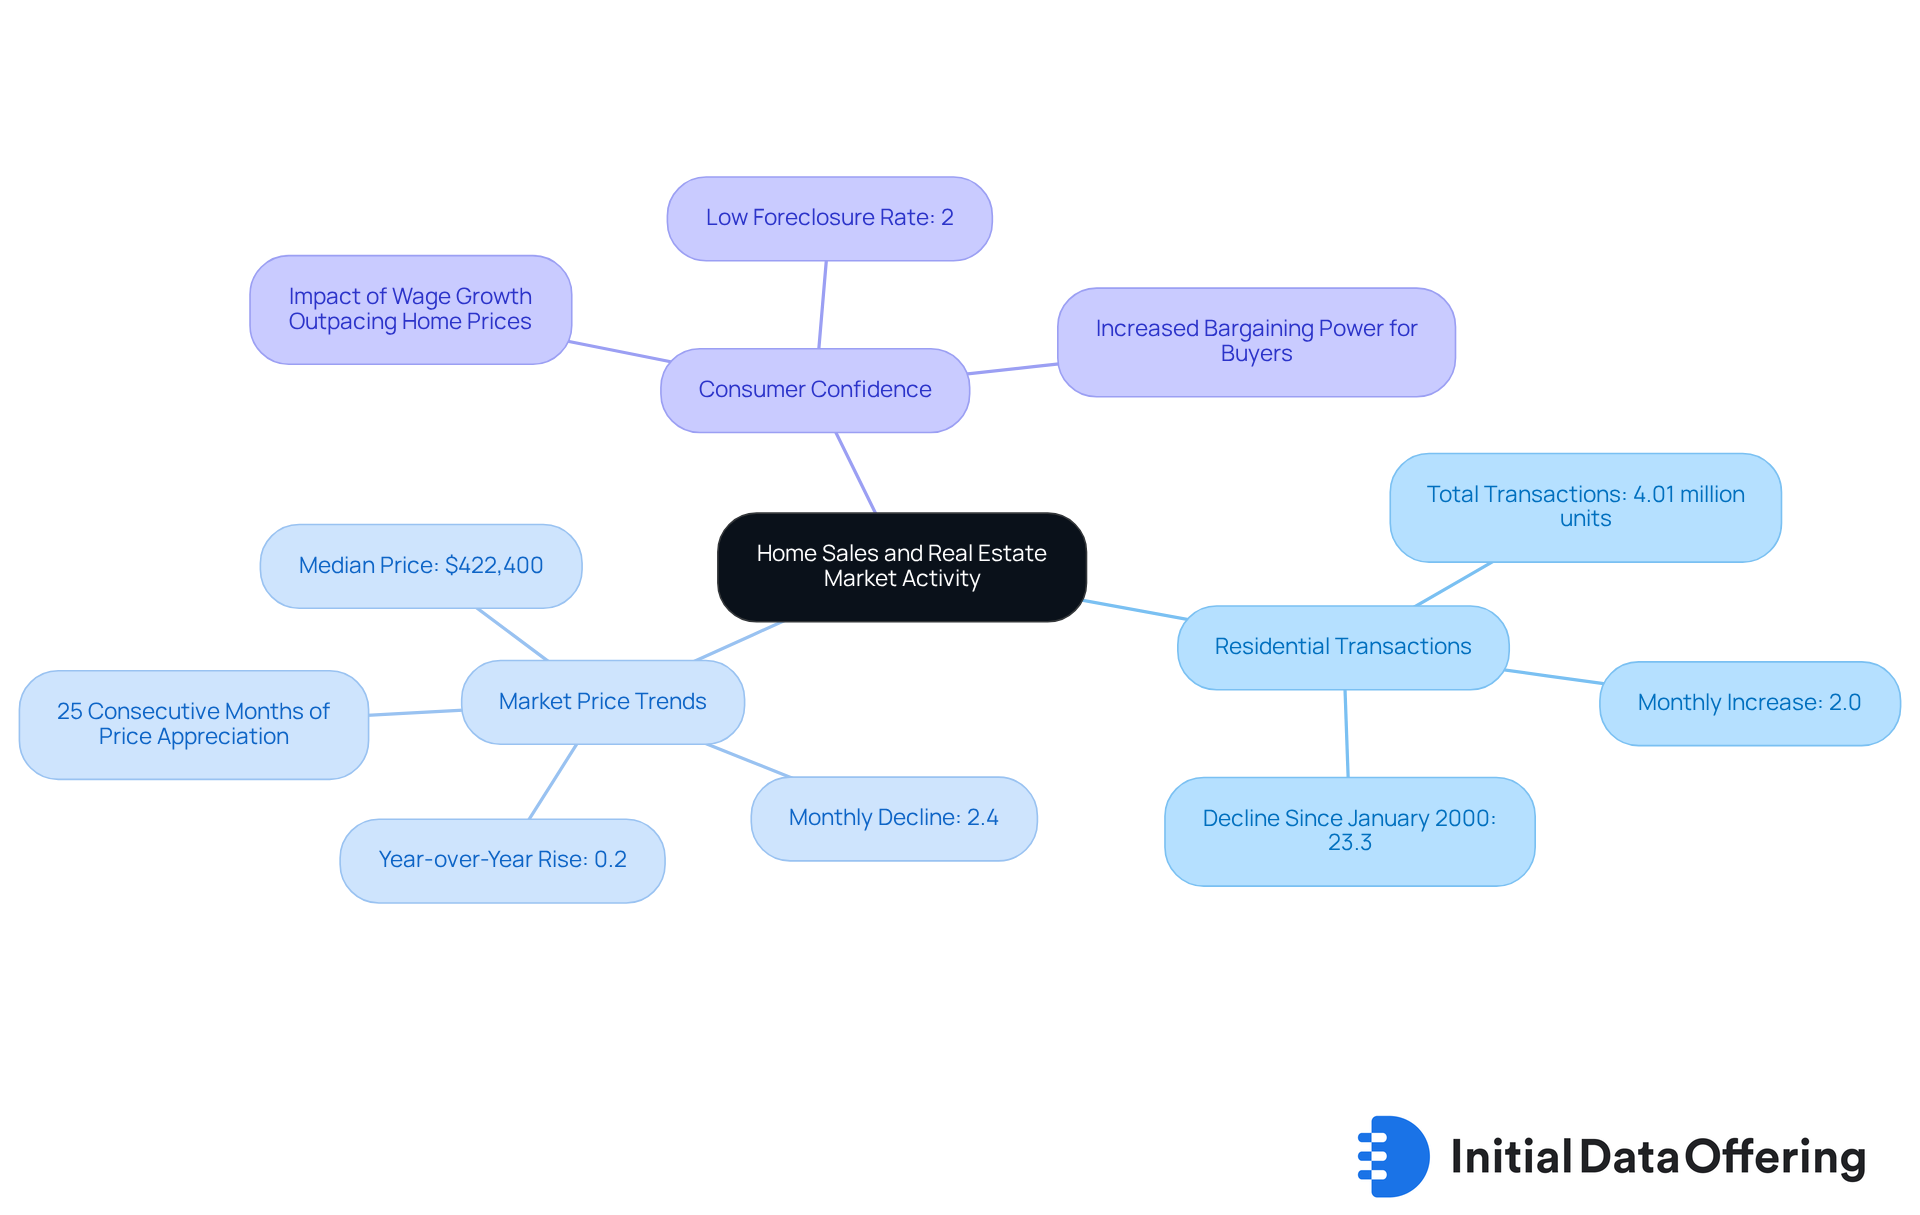
Residential transactions serve as a vital barometer of real estate market activity and consumer confidence. In July 2025, existing-home transactions reached 4.01 million units, reflecting a 2.0% increase from the prior month. However, there is a notable 23.3% decline compared to January 2000 estimates when adjusted for population growth. The median market price stood at $422,400, indicating a 2.4% decline from June but a 0.2% rise year-over-year, continuing a trend of 25 consecutive months of price appreciation. These figures, which are among the economic indicators this week, suggest a fairly stable real estate market that can encourage spending and contribute to overall growth.
Analysts should closely observe housing transaction trends. Fluctuations can indicate changes in economic stability and buyer sentiment, which are reflected in the economic indicators this week. For example, the existing stock of homes is at its peak since May 2020, offering purchasers increased bargaining power and possibly affecting future transaction dynamics. As mentioned by industry specialists, the interaction between residential transactions and consumer confidence remains essential. Enhanced affordability contributes to heightened activity. Lawrence Yun, NAR Chief Economist, noted that wage growth is now comfortably outpacing home price growth, giving buyers more options.
Additionally, with only 2% of sales being foreclosures or short sales, a historic low, the market appears stable. Understanding these trends is essential for making informed decisions in the ever-evolving real estate landscape. How might these dynamics impact your approach to real estate investment or sales strategies? The current data underscores the importance of staying informed and adaptable in this market.
Construction Spending: Indicator of Economic Investment
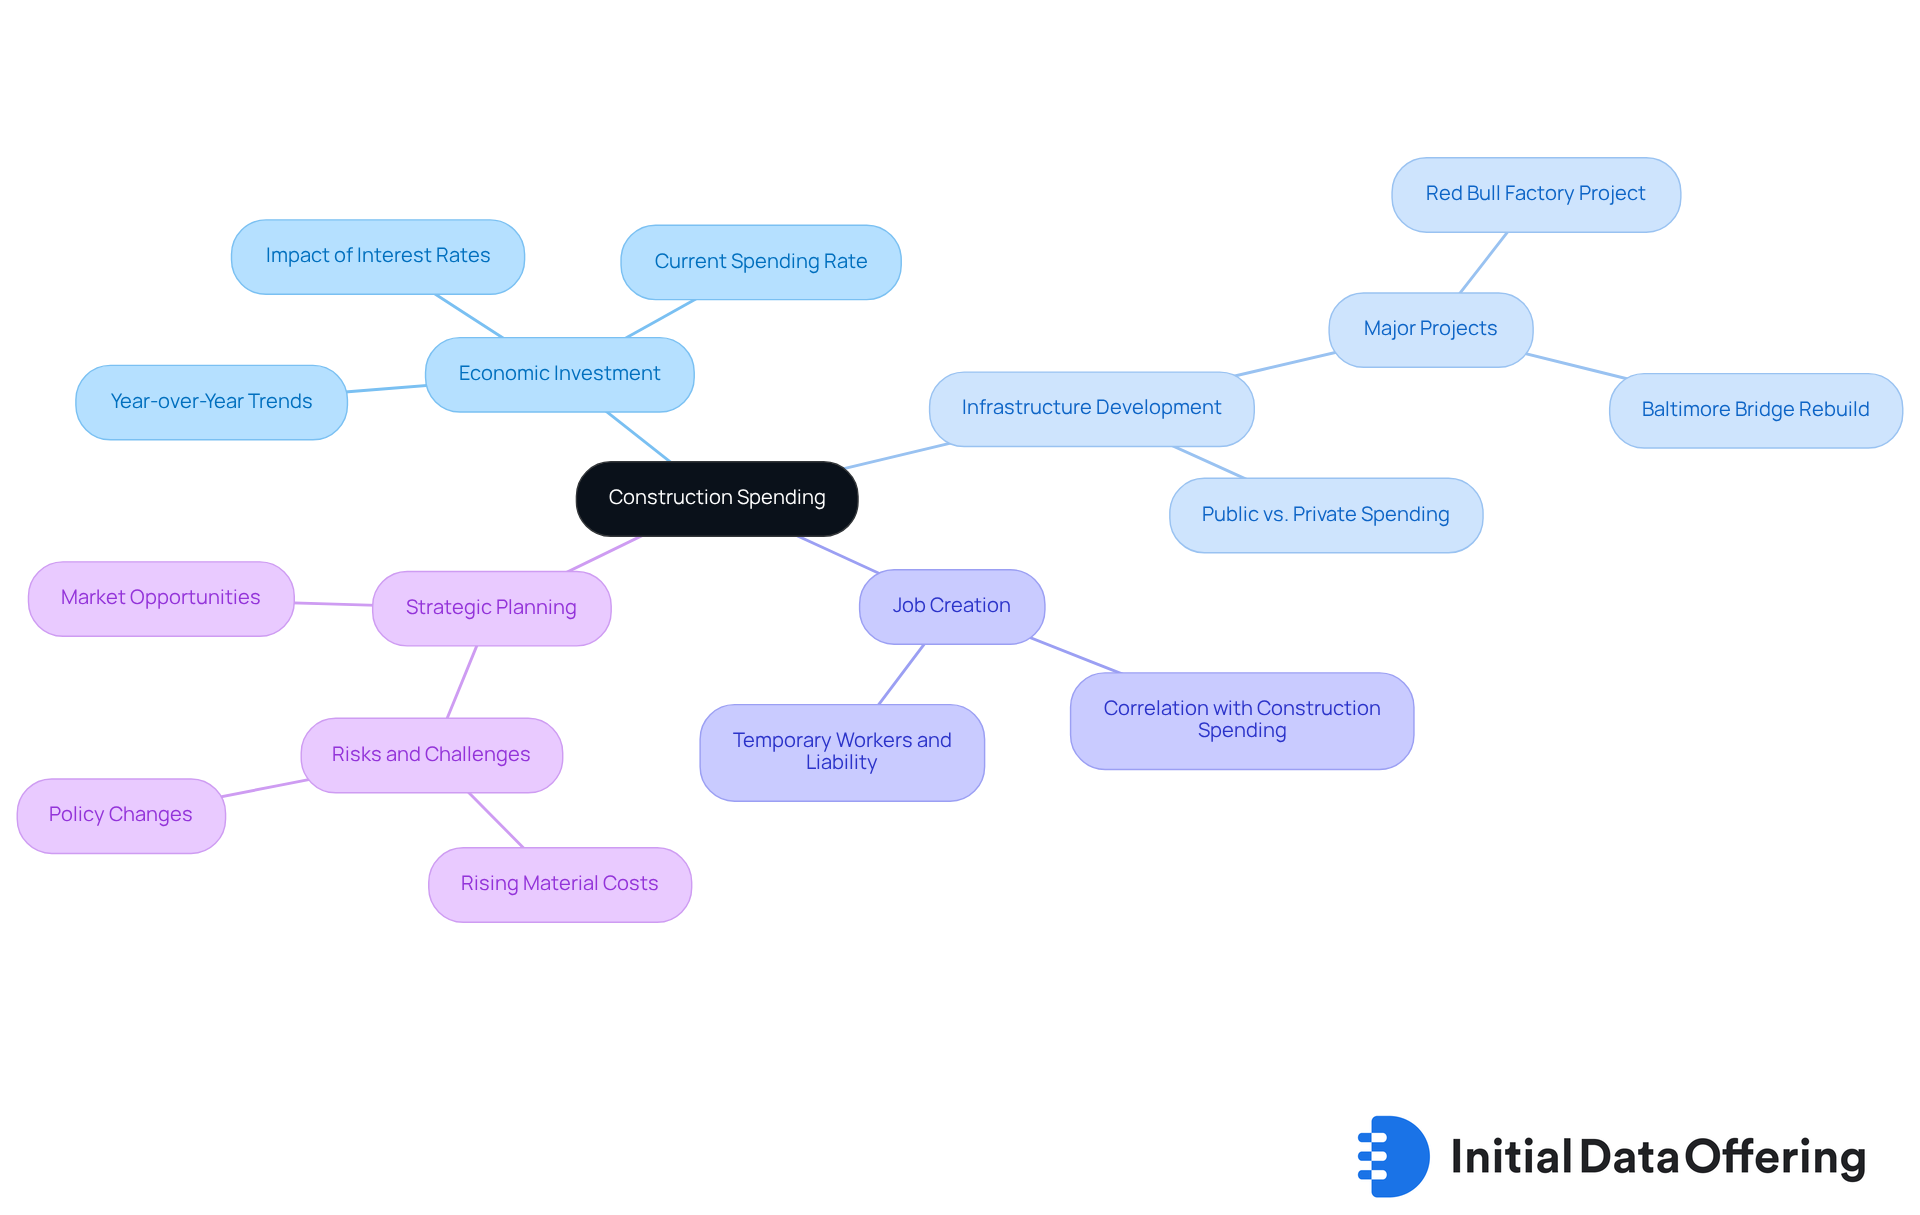
Construction expenditure serves as a crucial indicator of financial investment and infrastructure development. In July 2025, construction spending reached an estimated seasonally adjusted annual rate of $2,139.1 billion. This figure underscores the ongoing investment in the sector, highlighting its importance in economic growth. Analysts should closely monitor these economic indicators this week, as increased construction expenditure often correlates with job creation and overall economic expansion.
How might these trends influence your strategic planning? Understanding the implications of these expenditures can provide valuable insights into future opportunities in the market.
Manufacturing Demand: Insights into Production Levels
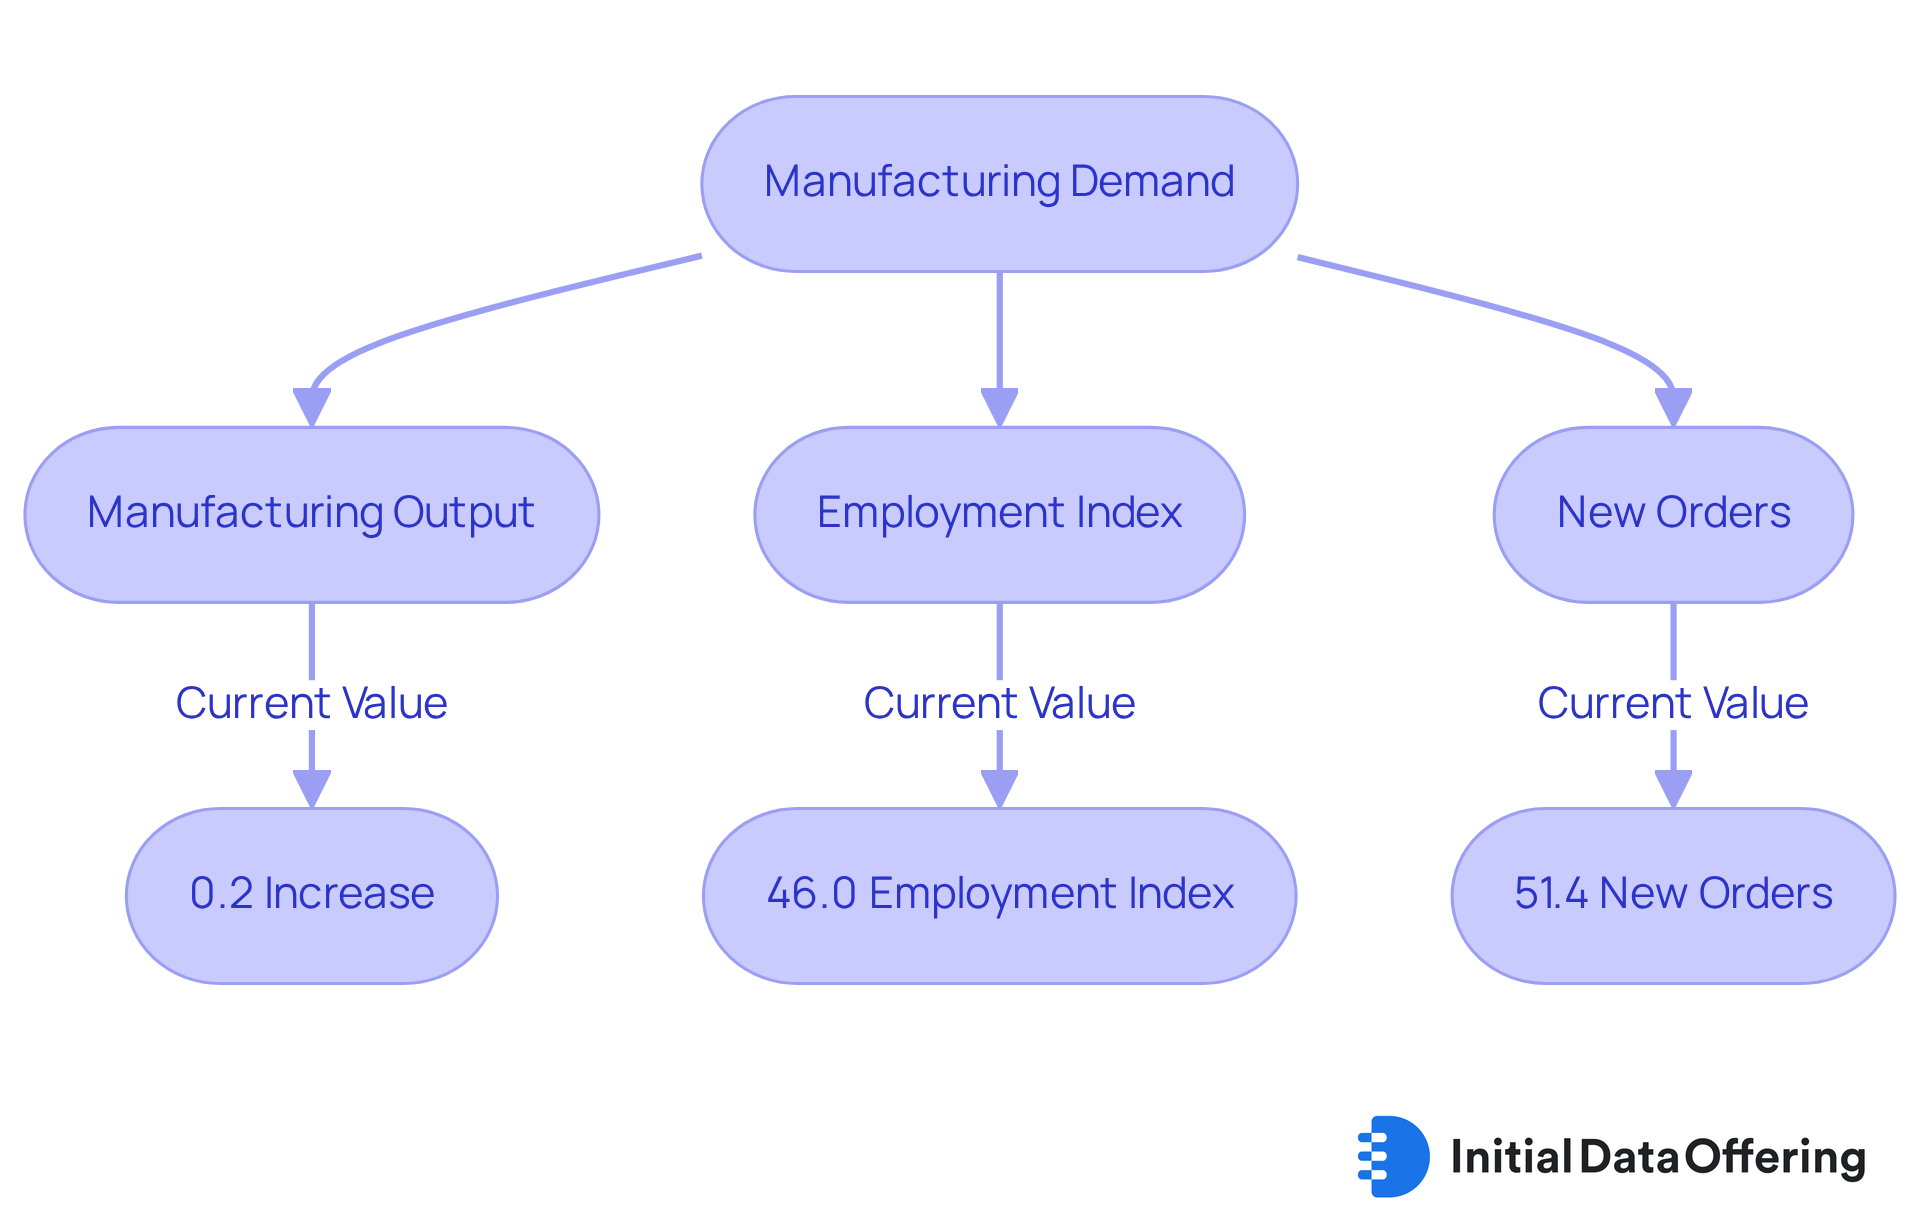
Manufacturing demand serves as a crucial indicator of production levels and overall financial activity. In August 2025, manufacturing output experienced a modest increase of 0.2%, signaling a potential recovery in demand. This uptick is particularly noteworthy, especially given that the manufacturing sector had faced contraction for six consecutive months prior to this slight rebound. Analysts should closely observe these trends this week, as variations in manufacturing demand often signal broader financial shifts reflected in economic indicators this week.
Historically, manufacturing output has proven to be a dependable indicator of financial well-being, reflecting shifts in consumer behavior and business investment. For instance, the recent Services PMI® report indicated growth in the services sector for the third consecutive month, reaching 52%. This growth may correlate with increased manufacturing activity as businesses respond to rising demand.
Furthermore, the employment index component of the Manufacturing PMI showed a slight improvement, rising to 46.0% in August from 43.4% in July. This suggests that manufacturers are cautiously optimistic about staffing levels in response to the uptick in demand. Experts such as Susan Spence from the Institute for Supply Management® have noted that despite ongoing challenges, the overall growth has continued for 64 months, highlighting the resilience of the manufacturing sector.
As production levels fluctuate, it is crucial to examine manufacturing demand data and economic indicators this week to identify trends and make informed forecasts about future market conditions. For example, the recent increase in new orders, which registered at 51.4% in August after six months of decline, provides hope for sustained production growth. Additionally, the Production Index fell to 47.8% in August, indicating challenges within the manufacturing landscape. This data not only reflects current market conditions but also serves as a vital tool for analysts aiming to navigate the complexities of forecasting.
Retail Sales: Direct Measure of Consumer Spending Habits
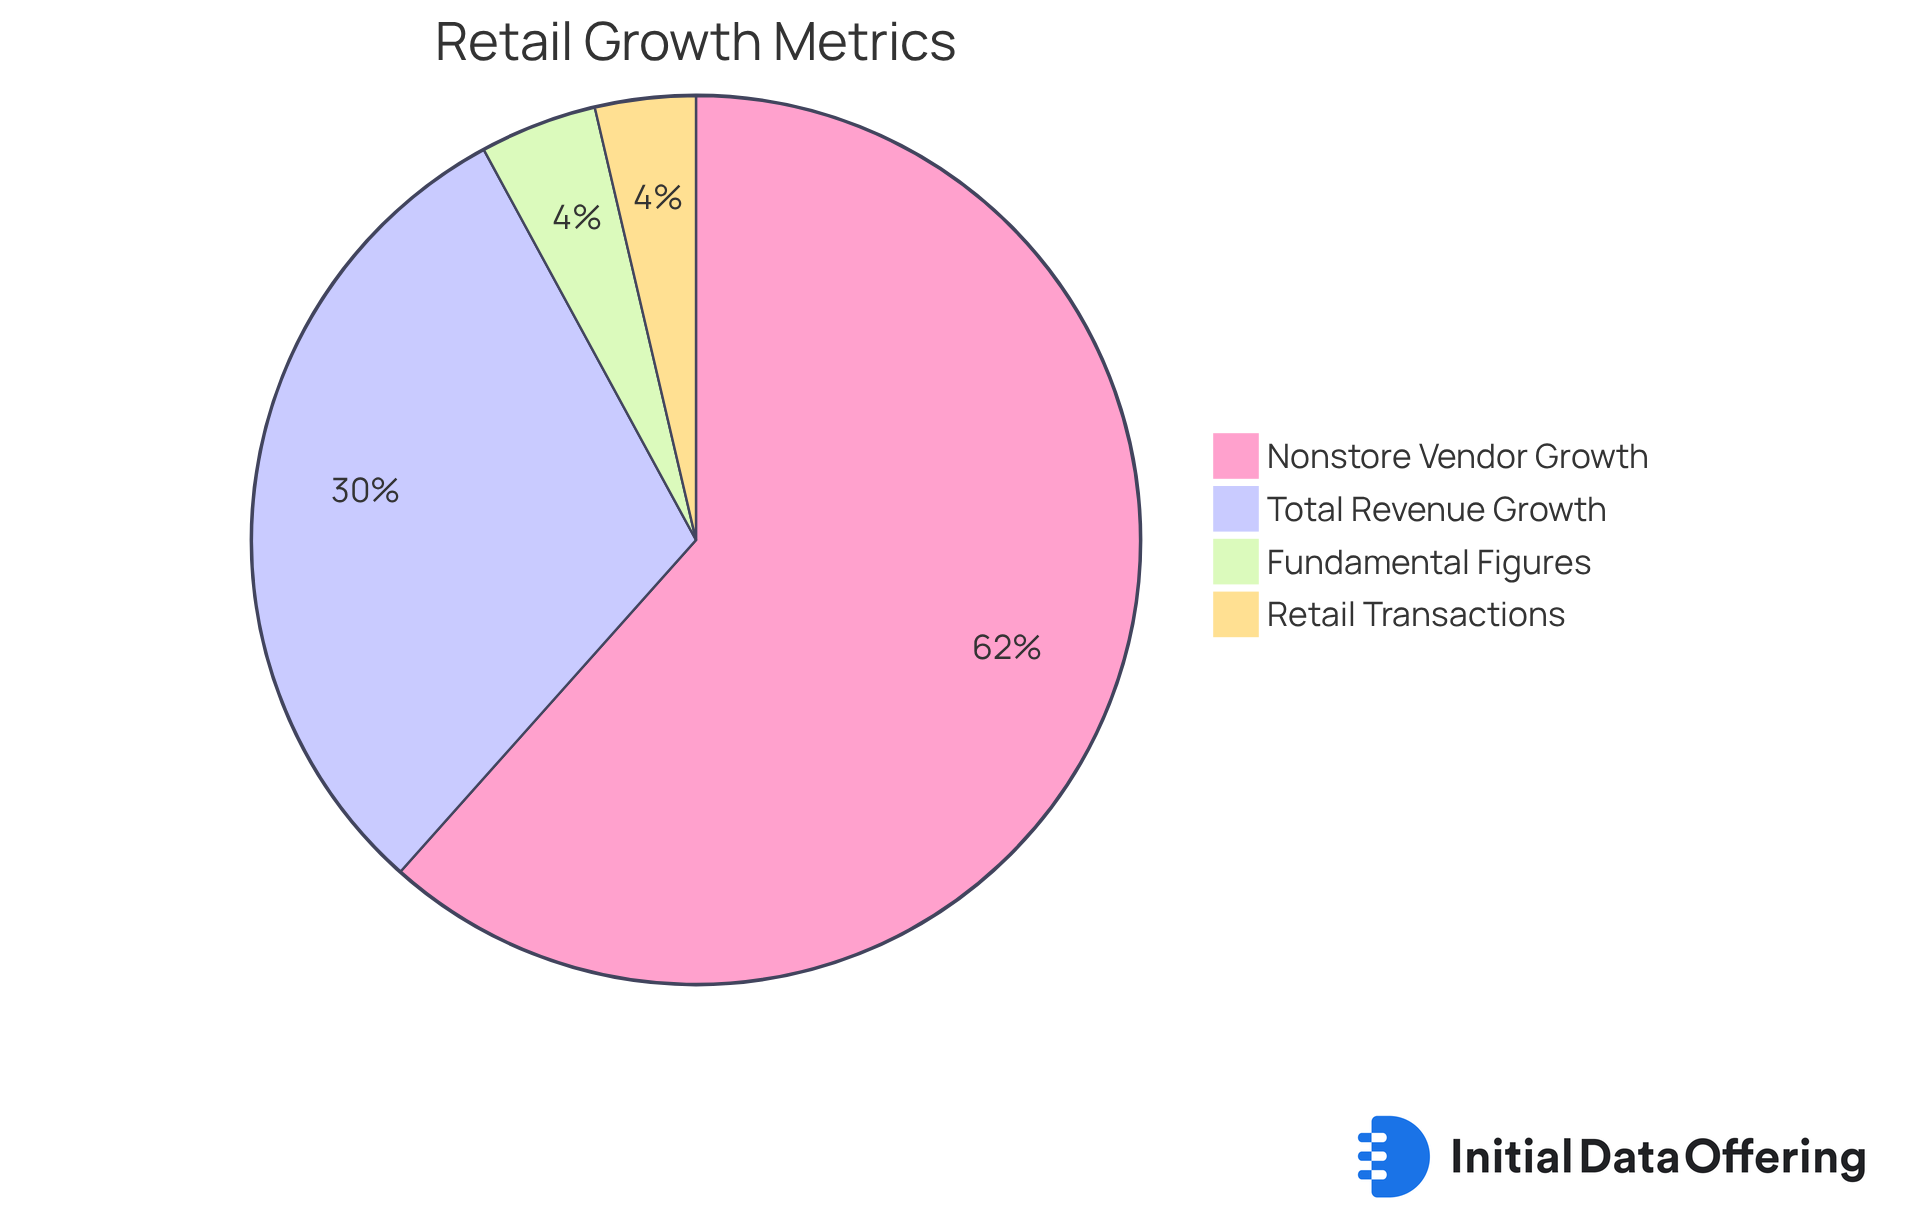
Retail transactions serve as a vital indicator of purchasing behaviors and overall financial health. In August 2025, retail transactions rose by 0.6%, reflecting buyer resilience in the face of ongoing financial challenges. This increase marks the third consecutive month of growth, with total retail revenue reaching $732.0 billion, a 5.0% increase from the previous year. Such trends are crucial for analysts, as the economic indicators this week offer insights into buyer confidence and spending habits, essential for forecasting future financial activity.
Traditionally, growth in retail revenue has acted as a reliable indicator of broader financial patterns. For instance, fundamental retail figures, which exclude volatile sectors like automobiles and gasoline, increased by 0.7% in August, up from July's adjusted 0.4% rise. This surpasses predictions and suggests a strengthening buyer base. Consequently, the Atlanta Fed has revised its third-quarter GDP growth estimate to 3.4%, which reflects the importance of retail performance and economic indicators this week for overall economic health.
Economists emphasize that tracking retail purchasing trends is crucial for understanding spending behaviors. The recent uptick in transactions, particularly among nonstore vendors, which saw an impressive 10.1% growth compared to the previous year, signals a shift in consumer preferences towards online shopping. As households contend with inflationary pressures and rising interest rates, these insights can guide strategic decisions across various sectors. Thus, retail sales remain a focal point for analysts in their economic evaluations.
Conclusion
The economic landscape is shaped by a multitude of indicators that provide essential insights for analysts. This week, it is crucial to track key economic indicators such as:
- GDP
- Employment figures
- Industrial production
- Consumer spending
- Inflation rates
- Home sales
- Construction spending
- Manufacturing demand
Each of these indicators serves as a vital tool for understanding market dynamics and making informed decisions in a rapidly evolving financial environment.
The significance of accessing comprehensive datasets through platforms like the Initial Data Offering (IDO) cannot be overstated. Analysts are encouraged to leverage these datasets to stay updated on trends and shifts in the economy. For instance, GDP reflects overall economic activity, while employment figures reveal labor market health. Additionally, consumer spending indicates economic confidence, and industrial production alongside construction spending provides insights into investment levels. Inflation rates and home sales further reflect broader economic stability.
In conclusion, monitoring these economic indicators is crucial for analysts aiming to navigate the complexities of the market. How can staying informed about current trends and utilizing reliable datasets empower decision-makers? Engaging with these insights not only enhances analytical capabilities but also fosters a deeper understanding of economic conditions. Ultimately, this leads to more effective forecasting and strategic planning.
Frequently Asked Questions
What is the Initial Data Offering (IDO)?
The IDO is a centralized hub for accessing a diverse range of financial datasets, designed to assist market research analysts in monitoring financial indicators and conducting analyses.
What types of datasets are available through the IDO?
The IDO offers datasets across various sectors, including finance, social media, and environmental studies, ensuring access to high-quality and unique datasets.
How does the IDO support analysts in their research?
The IDO streamlines the process of launching and discovering new datasets, provides advanced filtering features for customized searches, and adds new datasets daily to keep analysts informed.
What subscription options does the IDO provide?
The IDO offers flexible subscription options that allow users to tailor their data access according to their specific analysis needs.
Why is GDP an important economic measure?
GDP represents the total value of all goods and services produced in a country over a specific time period, serving as a key indicator of economic health and growth.
How frequently are GDP growth figures published?
GDP growth figures are published quarterly, providing essential data for assessing financial performance.
What recent GDP growth projection was made by the Federal Reserve Bank of Atlanta?
The GDPNow model projected a growth rate of 3.4% for Q3 2025, indicating a recovery following a decline in Q1 2025.
What employment figures are significant for analyzing labor market dynamics?
Key figures include the unemployment level and job creation statistics, which provide insights into labor market health.
What was the unemployment rate reported in August 2025?
The unemployment rate rose to 4.3%, the highest level since October 2021.
What trends in job creation were observed recently?
In August 2025, there was a modest increase of just 22,000 jobs, with job creation averaging only 29,000 per month over the past three months.
How does the unemployment rate affect consumer confidence?
Increasing unemployment rates typically correlate with diminished consumer confidence, leading to reduced spending, which is crucial for economic growth.
What actions is the Federal Reserve expected to consider in response to labor market challenges?
The Federal Reserve is expected to consider a quarter-percentage-point reduction to address labor market issues and its impact on consumer behavior.