Learn Data Analytics Free: Essential Steps for Market Analysts

Learn Data Analytics Free: Essential Steps for Market Analysts
Overview
To learn data analytics for free, aspiring market analysts should follow essential steps. These include:
- Understanding the fundamentals of different types of analytics
- Exploring free learning resources
- Applying skills through guided projects
First, it is crucial to grasp the four primary analytics types, as this foundational knowledge will enhance analytical capabilities. Next, valuable free resources such as Coursera and Google Analytics Academy offer extensive learning opportunities. Finally, practical experience is vital; engaging in projects on platforms like DataCamp and Kaggle allows learners to apply their skills effectively. By following these steps, aspiring analysts can build a strong foundation in data analytics without incurring costs.
Introduction
In an age where data drives decision-making, understanding the fundamentals of data analytics has become essential for market analysts. This guide provides a comprehensive pathway to mastering data analytics at no cost, highlighting various types of analytics and the resources available for effective learning.
However, with an overwhelming array of free courses and platforms, how can aspiring analysts discern which opportunities will truly enhance their skills and career prospects? This inquiry is crucial, as the right choices can significantly impact their professional development and success.
Understand Data Analytics Fundamentals
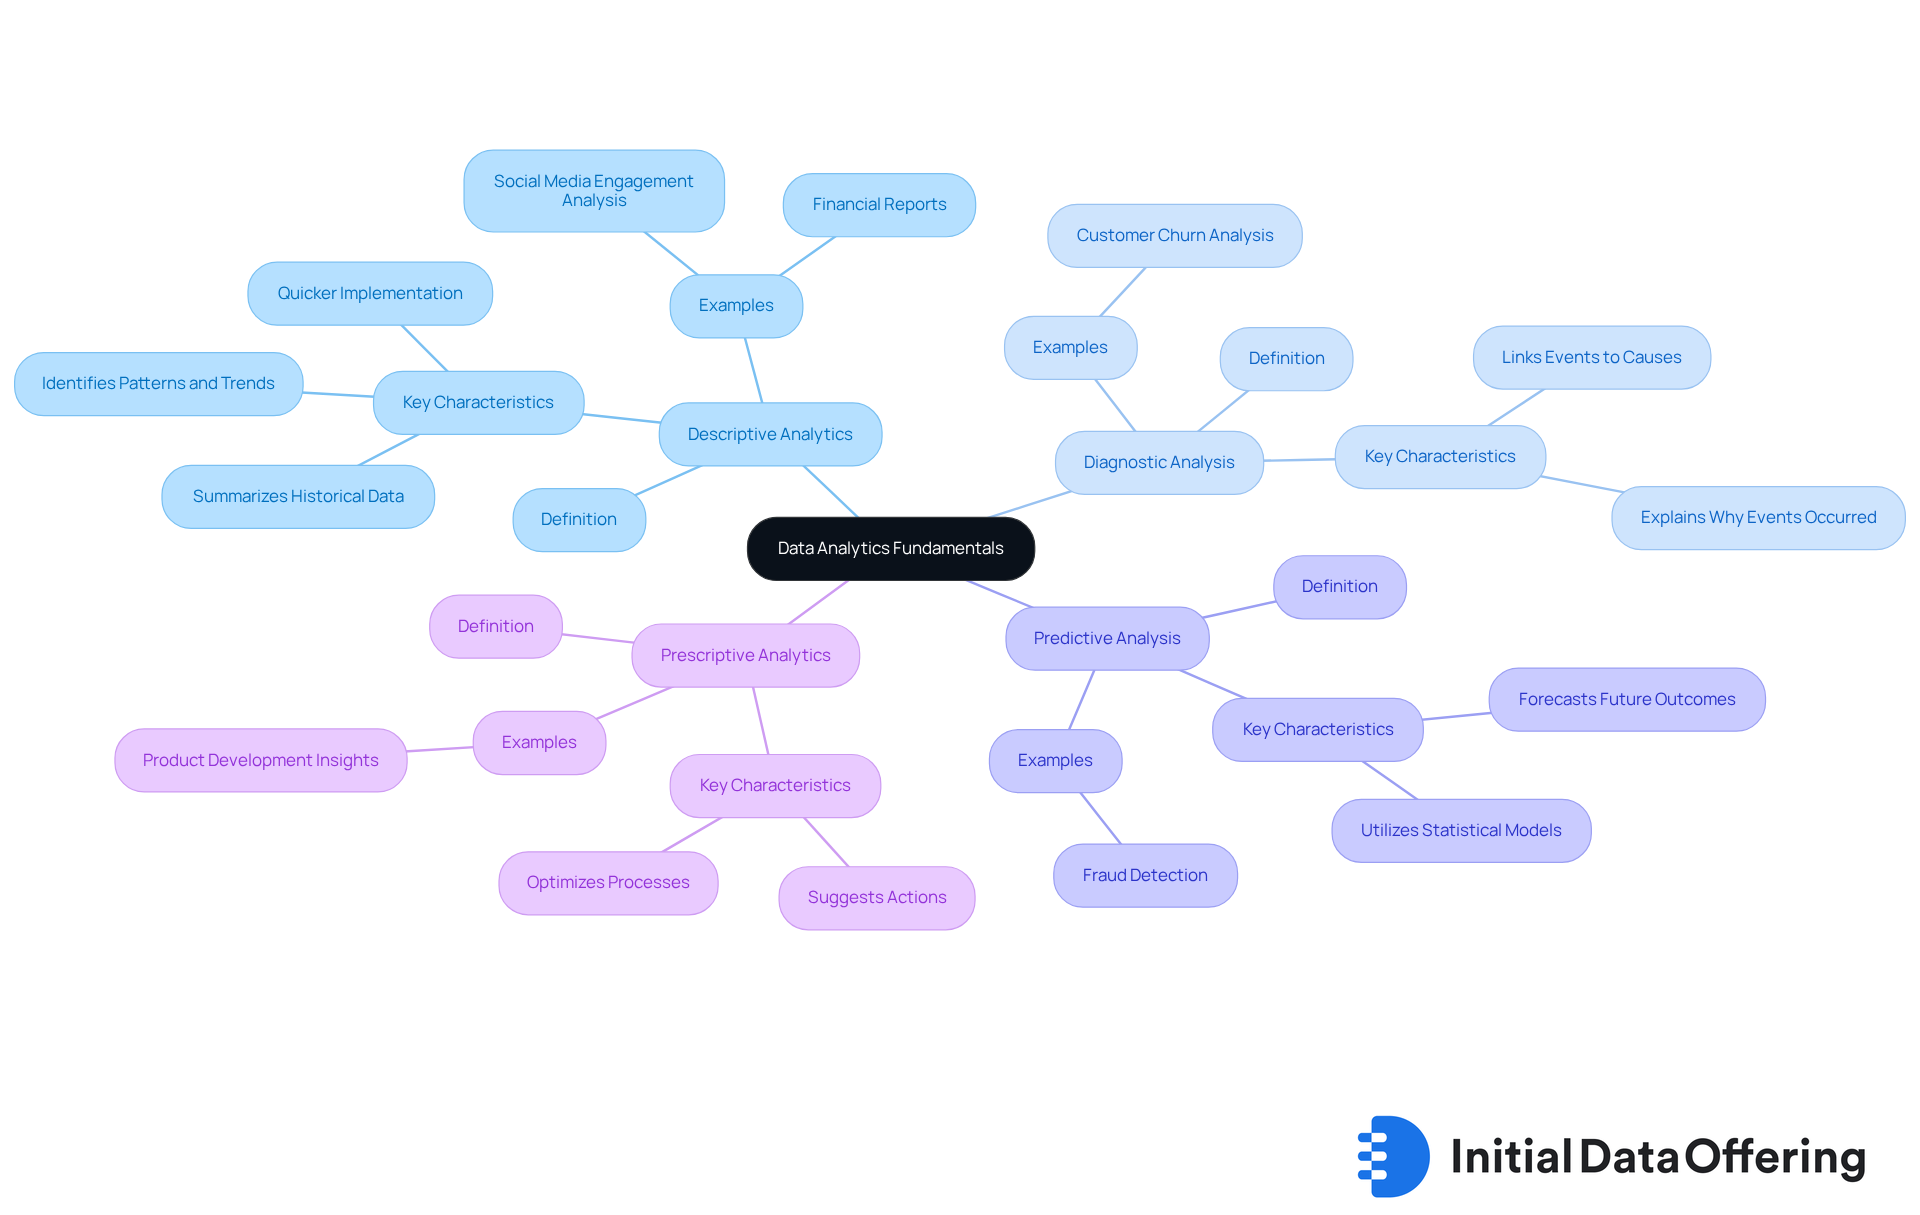
Information analysis involves the systematic computational examination of data, employing various techniques and processes that are essential for informed decision-making. Understanding the four primary types of analytics is crucial for effective application:
-
Descriptive Analytics: This type focuses on summarizing historical data to reveal patterns and trends, helping businesses understand what has transpired. For instance, generating financial reports or analyzing social media engagement can provide insights into customer behavior and operational performance. High-quality descriptive assessment relies on trustworthy information, robust methodology, and clearly defined KPIs, making it vital for effective analysis. Furthermore, descriptive analysis is quicker to implement than other types, enabling businesses to identify trends and patterns more swiftly.
-
Diagnostic Analysis: This type entails reviewing information to comprehend why particular events occurred. For example, a market research analyst might investigate a spike in customer churn, linking it to increased subscription pricing or service outages, thereby informing strategic adjustments.
-
Predictive Analysis: Utilizing statistical models and machine learning techniques, predictive analysis forecasts future outcomes based on historical data. This approach can enhance security by detecting anomalies, such as potential fraud or cybersecurity threats, allowing businesses to proactively address risks.
-
Prescriptive Analytics: This type suggests actions to capitalize on predictions, guiding organizations in optimizing processes and making data-driven decisions. For instance, in product development, prescriptive data analysis can identify essential features based on customer feedback and market research.
Grasping these fundamentals is essential for navigating the information analysis field efficiently. As we approach 2025, the importance of these data analysis types continues to grow, enabling organizations to refine strategies, improve operational efficiency, and foster innovation. Additionally, employing narrative methods in visual representation can significantly enhance stakeholder engagement, making insights more understandable and actionable. However, it is important to recognize that descriptive analysis is limited by its inability to forecast future results and heavily relies on the quality of the information utilized. Integrating perspectives from information analysis experts can further enrich this understanding, underscoring the critical role of each analysis type in strategic decision-making.

Explore Free Learning Resources for Data Analytics
Here are some excellent free resources to kickstart your data analytics journey:
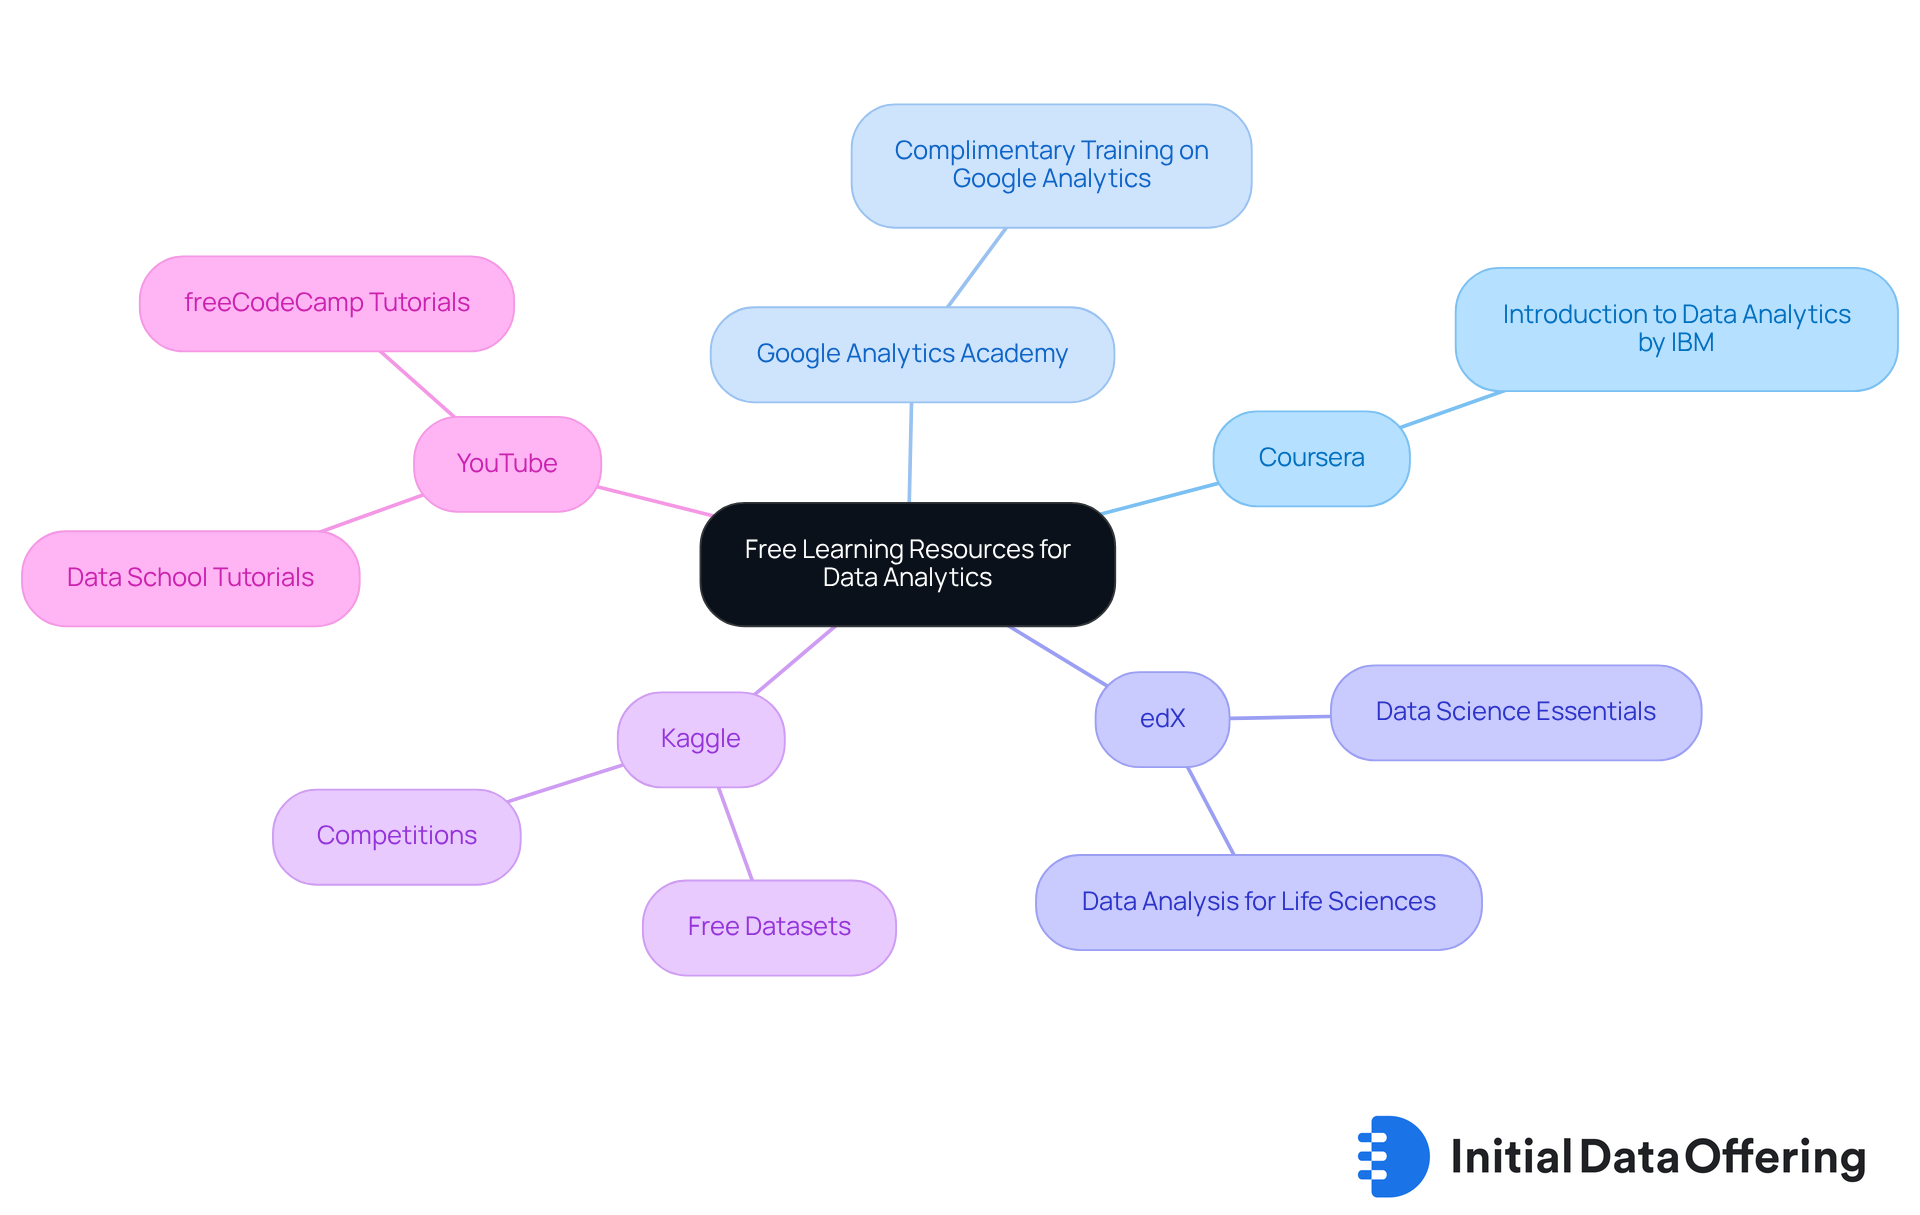
- Coursera: This platform offers free courses such as 'Introduction to Data Analytics' by IBM. This course covers the basics of data analysis, providing a solid foundation for beginners.
- Google Analytics Academy: This resource provides complimentary training on Google Analytics, an essential tool for analysts. Understanding this tool can significantly enhance your analytical skills.
- edX: Features free courses from top universities, including 'Data Science Essentials' and 'Data Analysis for Life Sciences'. These courses enable you to learn data analytics free from esteemed institutions, broadening your knowledge base.
- Kaggle: A platform that offers free datasets and competitions. Engaging with these resources allows you to learn data analytics free while practicing your skills in real-world scenarios, which enhances your practical understanding.
- YouTube: Channels such as freeCodeCamp and Data School provide tutorials on various information analysis subjects. These tutorials can serve as a supplementary resource to reinforce your learning.
Using these resources will assist you in establishing a solid base in information analysis. How will you integrate these tools into your learning journey?

Choose the Right Free Course for Your Needs
Selecting the right free course in data analytics necessitates careful consideration of several key factors:
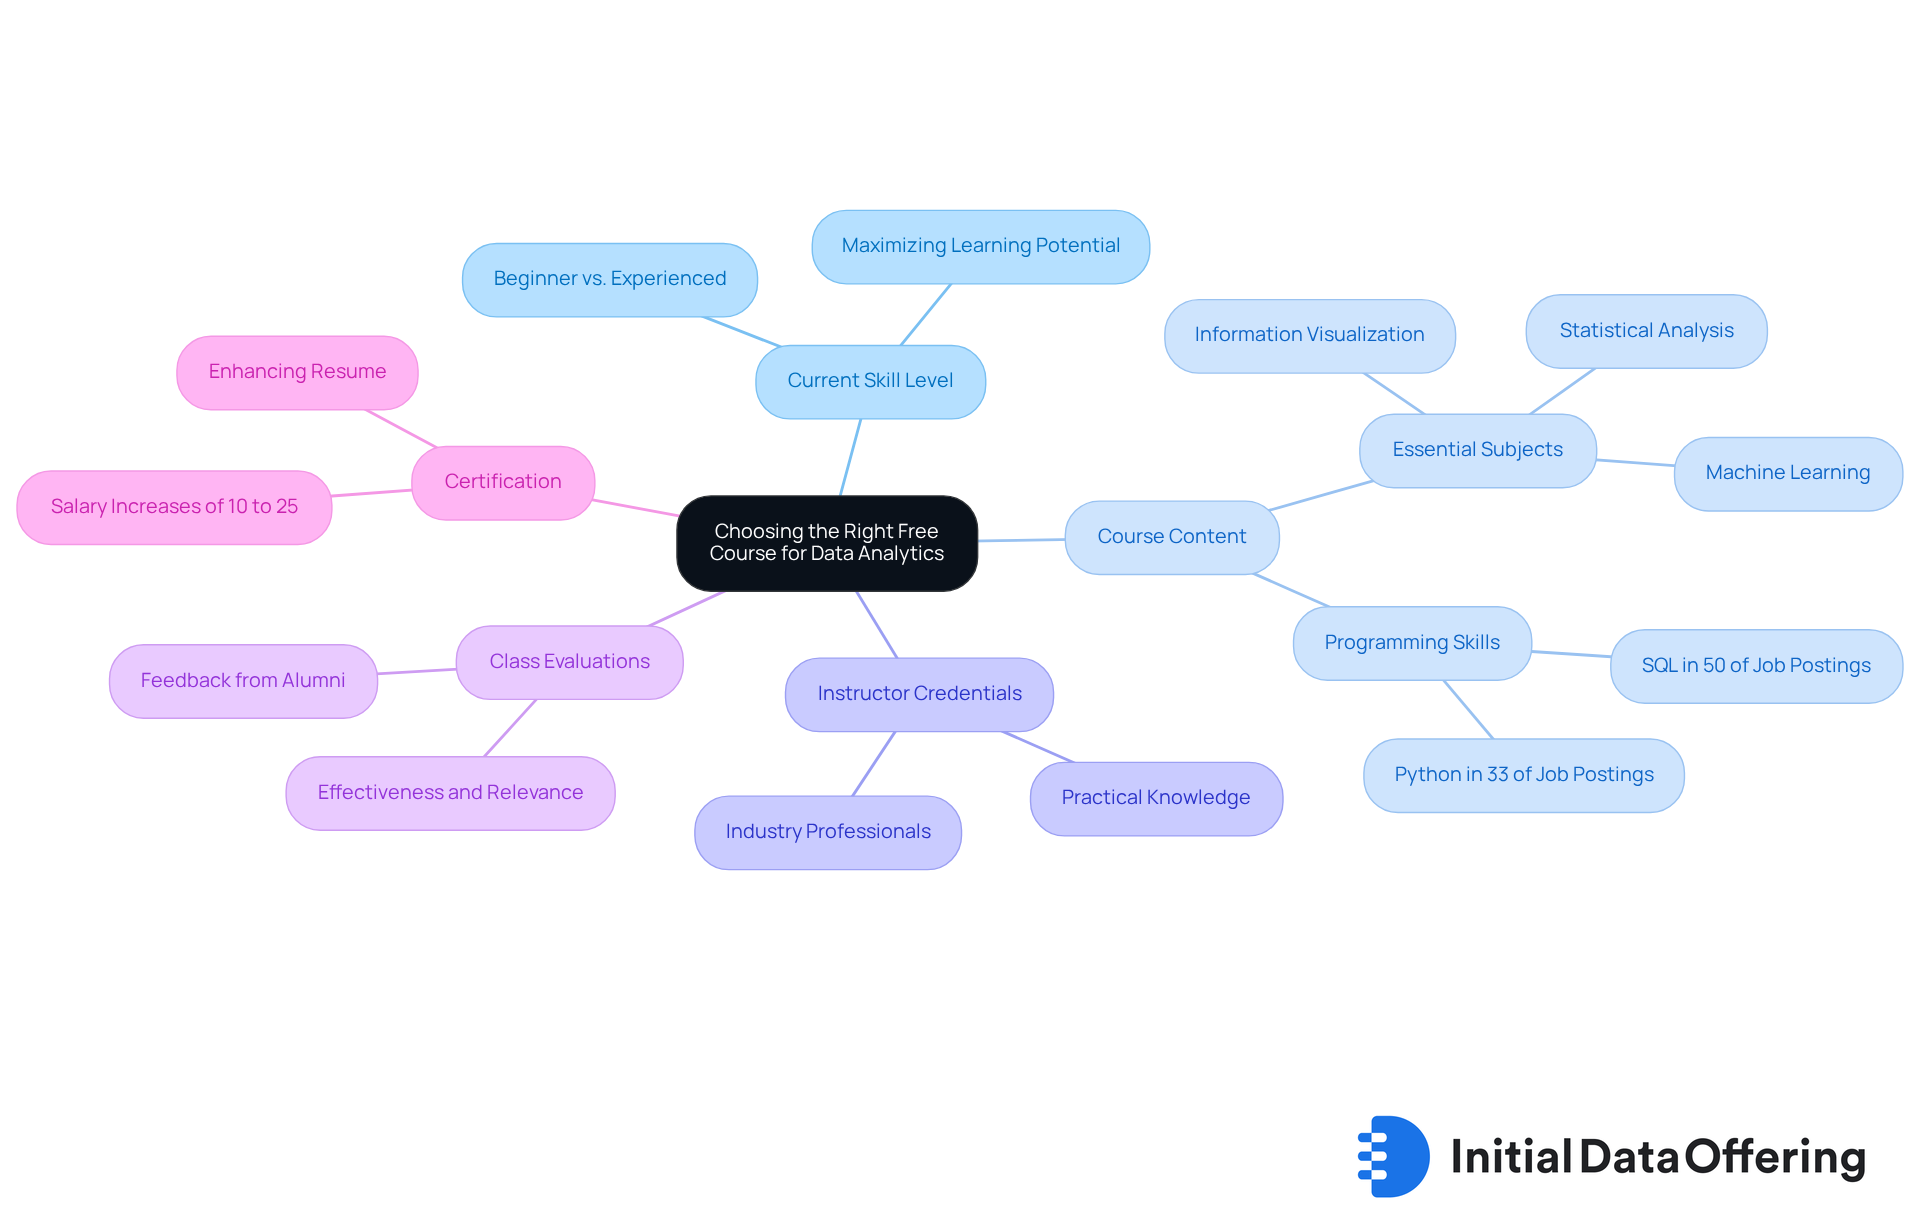
- Current Skill Level: It is crucial to assess whether you are a complete beginner or possess some prior experience. Choosing courses that align with your proficiency will maximize your learning potential.
- Course Content: Review the syllabus to ensure it encompasses essential subjects such as information visualization, statistical analysis, and machine learning. These topics are vital for a comprehensive understanding of information evaluation. Current trends indicate that programming skills, particularly in SQL and Python, are increasingly important, appearing in approximately 50% and 33% of job postings, respectively.
- Instructor Credentials: Examine the instructor's background and experience in information analysis. Courses led by industry professionals often provide deeper insights and practical knowledge. As John Johnson, an economist, observes, "This program emphasizes utilizing data analytics to aid data-informed business choices and attain a competitive edge."
- Class Evaluations: Seek feedback and ratings from former students to assess the program's effectiveness and its relevance to your learning objectives. With over 40,000 alumni from FreeCodeCamp securing jobs at top companies, student reviews can offer valuable insights.
- Certification: Consider whether the program provides a certificate upon completion. Certifications from recognized institutions can enhance your resume and demonstrate your commitment to professional development. Professionals with certifications like the Google Data Analytics Certificate often experience salary increases of 10% to 25% compared to those without.
By thoughtfully evaluating these factors, you can select a course that will allow you to learn data analytics free while aligning with your learning objectives and career aspirations. As industry experts highlight, the correct educational route can significantly influence your career path in information analysis. For instance, the Google Data Analytics Certificate costs $49 per month after a 7-day free trial, making it an accessible option for many learners.

Apply Your Skills Through Guided Projects
Engaging in guided projects can be highly beneficial if you want to learn data analytics free and strengthen your comprehension of analytics. Consider the following platforms that offer such opportunities:
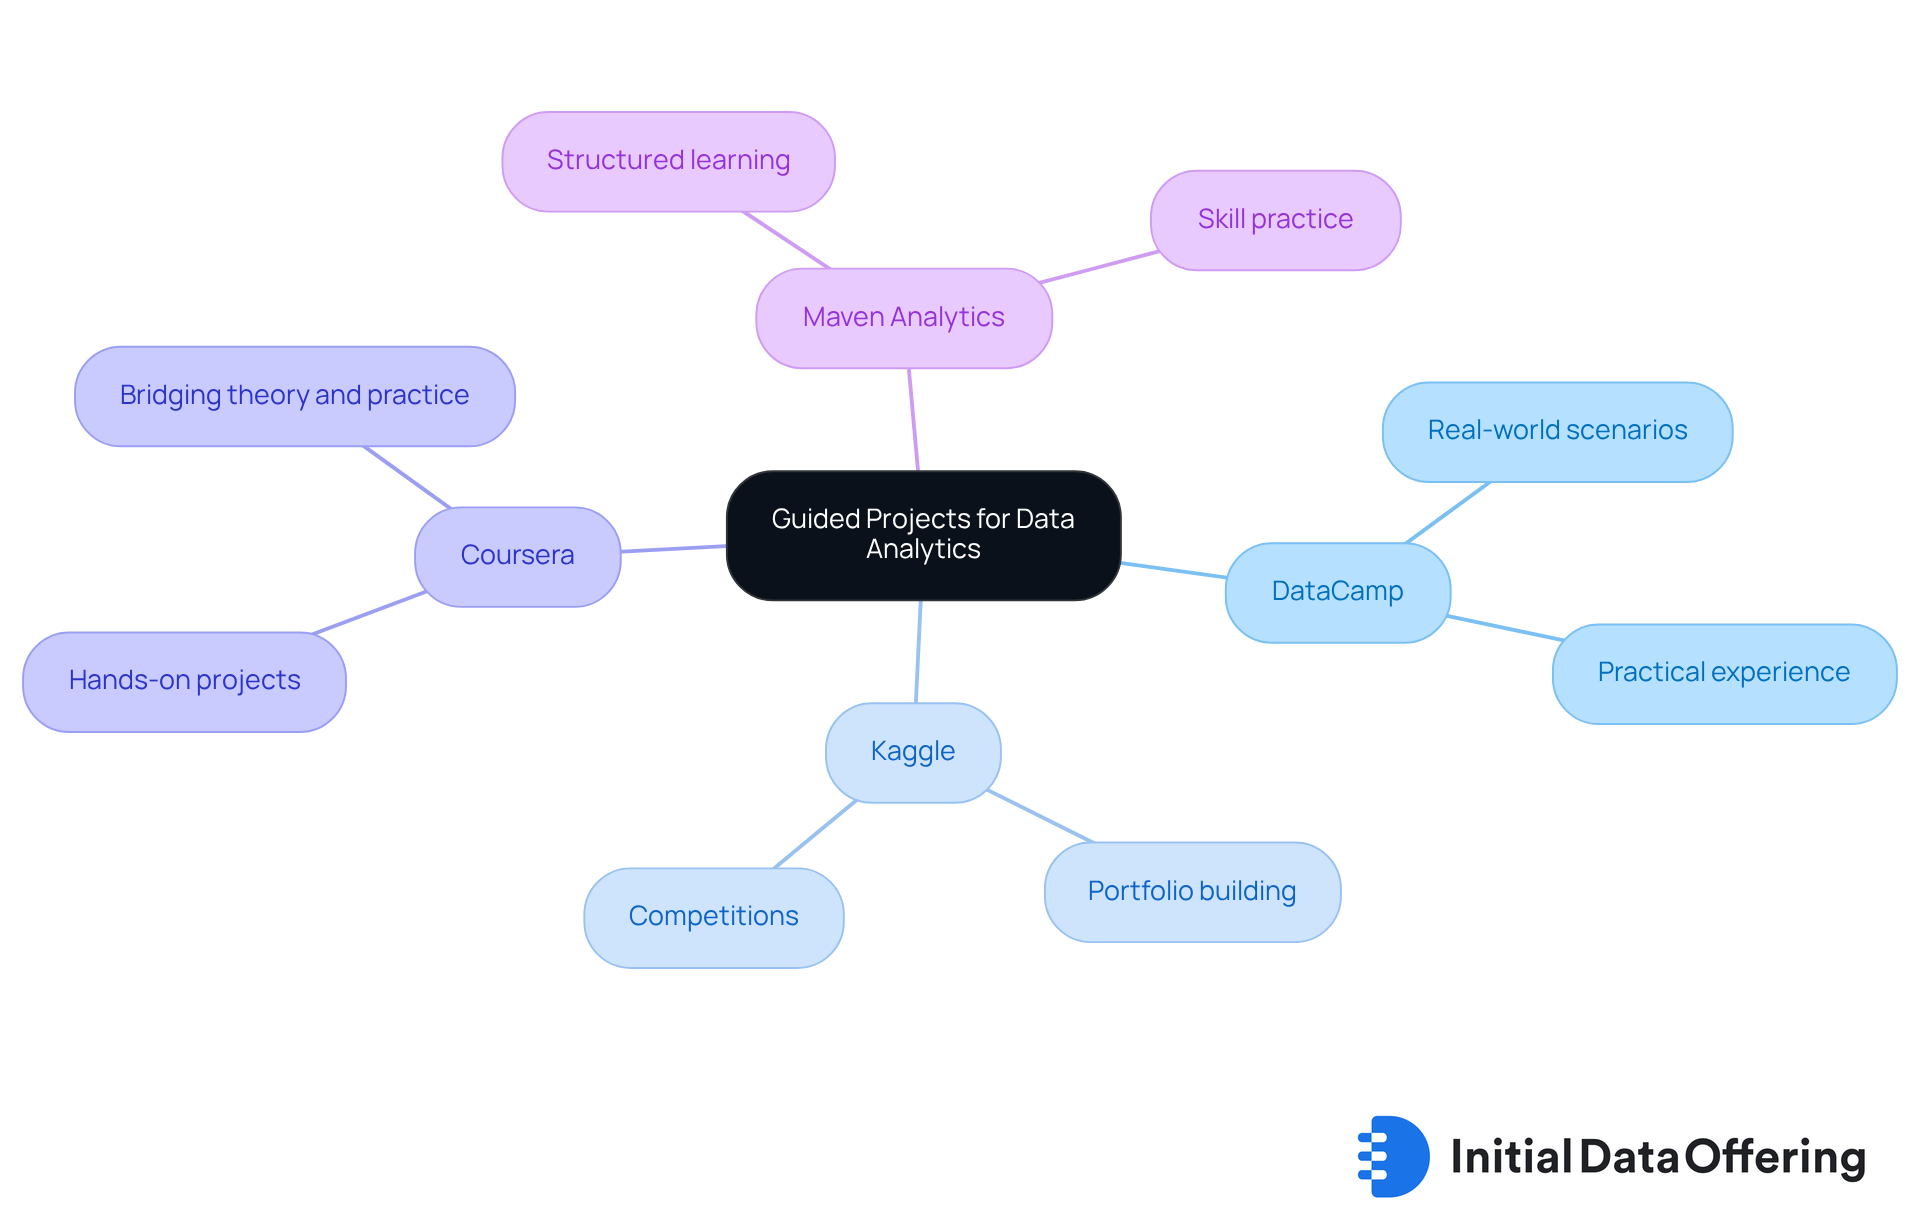
- DataCamp: This platform provides guided projects that allow you to apply your skills in real-world scenarios, such as analyzing a dataset or creating visualizations. The advantage here is that you gain practical experience, which is crucial to learn data analytics free and build your analytical capabilities.
- Kaggle: By participating in competitions or working on datasets, you can practice your skills and build a portfolio. This not only enhances your learning but also showcases your abilities to potential employers.
- Coursera: Many courses on this platform provide opportunities to learn data analytics free with hands-on projects that simulate real-world data analysis tasks. This feature allows you to learn data analytics free while effectively bridging the gap between theory and practice.
- Maven Analytics: They offer guided projects that allow you to learn data analytics free while practicing your skills and building a portfolio, providing a structured approach to learning.
Completing these projects will not only enhance your skills but also provide tangible evidence of your capabilities to potential employers. How can you leverage these opportunities to advance your career in analytics?

Conclusion
Understanding data analytics is not merely a skill; it is a necessity for market analysts striving to excel in an increasingly data-driven landscape. Mastering the fundamentals of descriptive, diagnostic, predictive, and prescriptive analytics equips professionals with essential tools to make informed decisions, identify trends, and optimize strategies. As organizations increasingly rely on data for strategic initiatives, the ability to analyze and interpret this data effectively becomes paramount.
This article has outlined essential steps for embarking on a data analytics journey, emphasizing the significance of foundational knowledge, the availability of free learning resources, and the importance of selecting courses tailored to individual needs. Platforms like Coursera and Google Analytics Academy, alongside hands-on projects offered by DataCamp and Kaggle, present aspiring analysts with a wealth of opportunities to enhance their skills without financial barriers. Moreover, understanding the criteria for choosing the right course—such as current skill level and instructor credentials—ensures that learners maximize their educational experiences.
In a world where data drives decision-making, taking the initiative to learn data analytics can unlock numerous career opportunities and foster professional growth. By leveraging the resources available and applying skills through guided projects, individuals can enhance their analytical capabilities and position themselves as valuable assets in their respective fields. Embrace the journey of learning data analytics and transform insights into impactful actions that can shape the future of any organization.
Frequently Asked Questions
What is data analytics?
Data analytics involves the systematic computational examination of data using various techniques and processes to facilitate informed decision-making.
What are the four primary types of analytics?
The four primary types of analytics are Descriptive Analytics, Diagnostic Analysis, Predictive Analysis, and Prescriptive Analytics.
What is Descriptive Analytics?
Descriptive Analytics focuses on summarizing historical data to reveal patterns and trends, helping businesses understand what has transpired. It includes generating reports and analyzing engagement metrics.
How does Diagnostic Analysis differ from Descriptive Analytics?
Diagnostic Analysis reviews information to understand why specific events occurred, such as investigating reasons for customer churn, whereas Descriptive Analytics summarizes past data.
What is the purpose of Predictive Analysis?
Predictive Analysis uses statistical models and machine learning techniques to forecast future outcomes based on historical data, helping businesses identify potential risks like fraud or cybersecurity threats.
How does Prescriptive Analytics assist organizations?
Prescriptive Analytics suggests actions to capitalize on predictions, guiding organizations in optimizing processes and making data-driven decisions, such as identifying product features based on customer feedback.
Why is understanding these types of analytics important?
Understanding these analytics is crucial for efficiently navigating the information analysis field, refining strategies, improving operational efficiency, and fostering innovation.
What is a limitation of Descriptive Analytics?
A limitation of Descriptive Analytics is that it cannot forecast future results and heavily relies on the quality of the information utilized.
How can narrative methods enhance data analysis?
Employing narrative methods in visual representation can significantly enhance stakeholder engagement, making insights more understandable and actionable.