10 Benefits of Using Dynamic Tables for Data Analysis

10 Benefits of Using Dynamic Tables for Data Analysis
Overview
The article outlines ten benefits of using dynamic tables for data analysis, emphasizing their features, advantages, and the benefits they provide. Dynamic tables enhance efficiency, collaboration, and decision-making through real-time updates and customizable views.
For instance, organizations that have successfully implemented dynamic tables have demonstrated significant improvements in productivity and insight generation. These enhancements lead to better overall data management processes.
How might your organization benefit from adopting dynamic tables? By considering these examples, you can explore actionable insights that may apply to your work.
Introduction
Dynamic tables have emerged as a transformative tool in data analysis, revolutionizing how organizations interact with and interpret vast amounts of information. These tables automate updates and offer customizable views, which streamline data management and enhance productivity and decision-making capabilities. However, as businesses increasingly rely on dynamic tables, a pressing question arises: how can they fully harness these flexible frameworks to generate actionable insights and foster collaboration in a data-driven environment?
Exploring the multifaceted benefits of dynamic tables reveals their potential to reshape the landscape of data analysis. By providing real-time data updates, organizations can ensure that their decisions are based on the most current information available. This capability not only improves accuracy but also empowers users to make informed, strategic decisions. In a world where data-driven insights are paramount, dynamic tables stand out as essential tools for fostering collaboration and enhancing overall efficiency.
Initial Data Offering: Streamlined Dynamic Tables for Enhanced Data Analysis
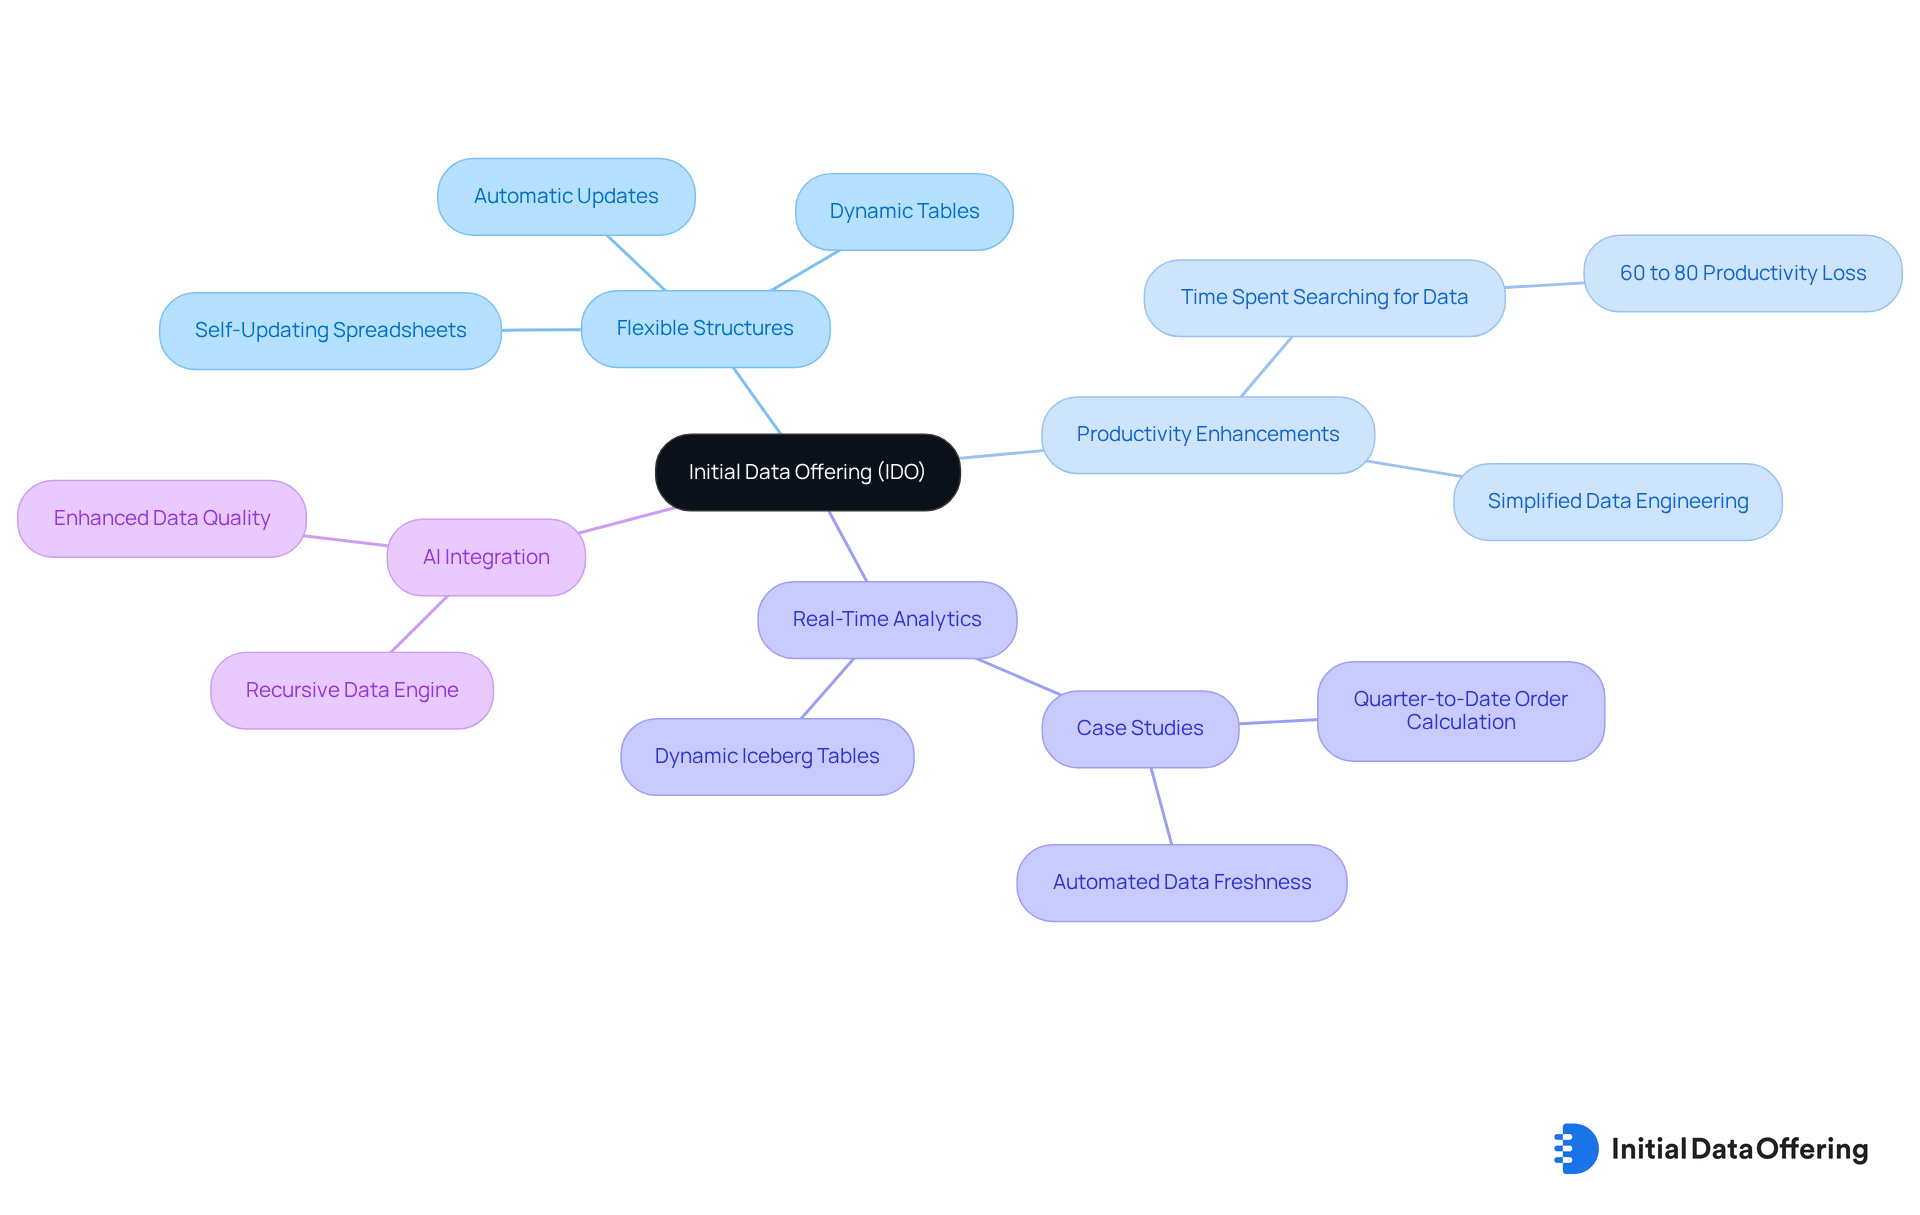
Initial Data Offering (IDO) leverages the capabilities of flexible structures to improve information analysis procedures. These structures automatically update according to preset queries, ensuring users have immediate access to the latest information without the need for manual adjustments. This feature is essential for businesses and researchers who rely on timely insights for informed decision-making. By employing flexible structures, IDO significantly enhances the user experience, facilitating more effective information exploration and analysis.
Dynamic tables not only optimize information operations but also enhance overall productivity. Research indicates that professionals often spend 60% to 80% of their time searching for information, leading to considerable productivity losses. By utilizing flexible structures, this challenge is mitigated, allowing users to focus on deriving insights rather than managing information infrastructure.
The practical applications of flexible structures underscore their effectiveness in boosting analysis efficiency. For instance, organizations that implement flexible charts can achieve real-time analytics, enabling them to respond swiftly to market changes. A notable case study involves a global retail company that effectively used flexible charts to calculate quarter-to-date order totals, streamlining their analysis process without the complexities associated with traditional methods.
Moreover, the integration of AI-driven solutions, such as those offered by SavvyIQ, enhances the capabilities of dynamic tables by providing a robust information infrastructure that continuously enriches and expands datasets through the Recursive Data Engine. This engine facilitates the dynamic updating of information, ensuring users have access to the most relevant and high-quality datasets. Experts in the field emphasize the importance of real-time information access. As Eric Schmidt, Executive Chairman at Google, points out, the increasing reliance on skilled information specialists is vital for transforming large volumes of available data into actionable insights. Analysts echo this sentiment, recognizing that timely information is crucial for making informed business decisions. By adopting flexible structures, IDO empowers users to fully leverage their data capabilities, ultimately fostering improved outcomes and cultivating an information-driven culture.
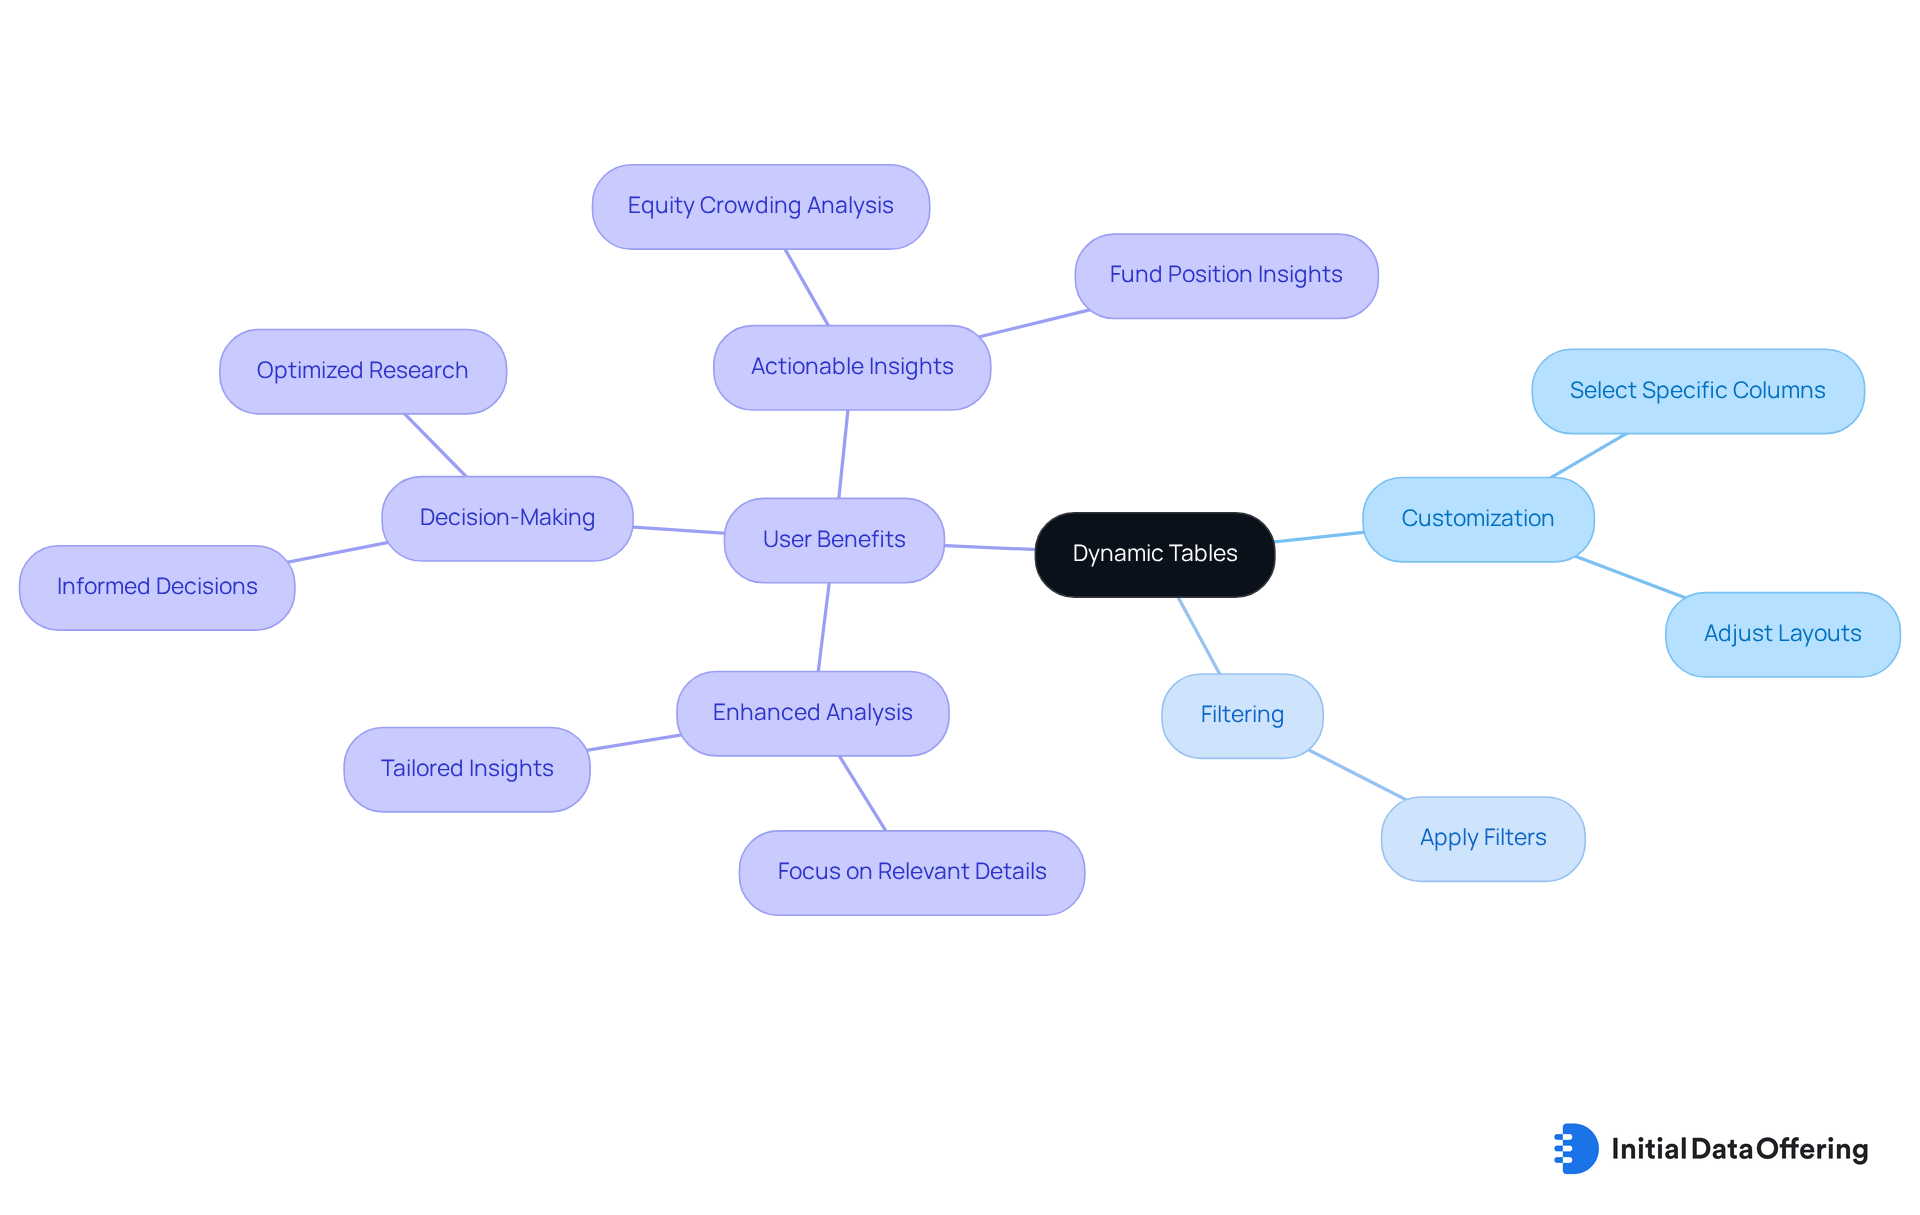
Flexibility: Customize Data Presentations with Dynamic Tables
Dynamic tables offer remarkable adaptability in showcasing information, particularly when handling extensive datasets like Hazeltree's Long and Short Equity Positioning Insights. This dataset encompasses 15,000 equities sourced from over 600 funds, representing $700 billion in GMV. Users benefit from the ability to customize their views in a dynamic table by selecting specific columns, applying filters, and adjusting layouts to cater to their analytical needs. This flexibility is vital for market research analysts who require tailored insights from complex datasets presented in a dynamic table, such as anonymized and aggregated long and short position information.
By allowing users to modify information displays, a dynamic table enables them to focus on the most relevant details, thereby enhancing analysis and decision-making related to equity crowding and fund positions. How can analysts leverage these adaptable data structures to extract actionable insights that align with their strategic objectives? Analysts are encouraged to utilize these flexible frameworks to optimize their research and drive informed decisions.
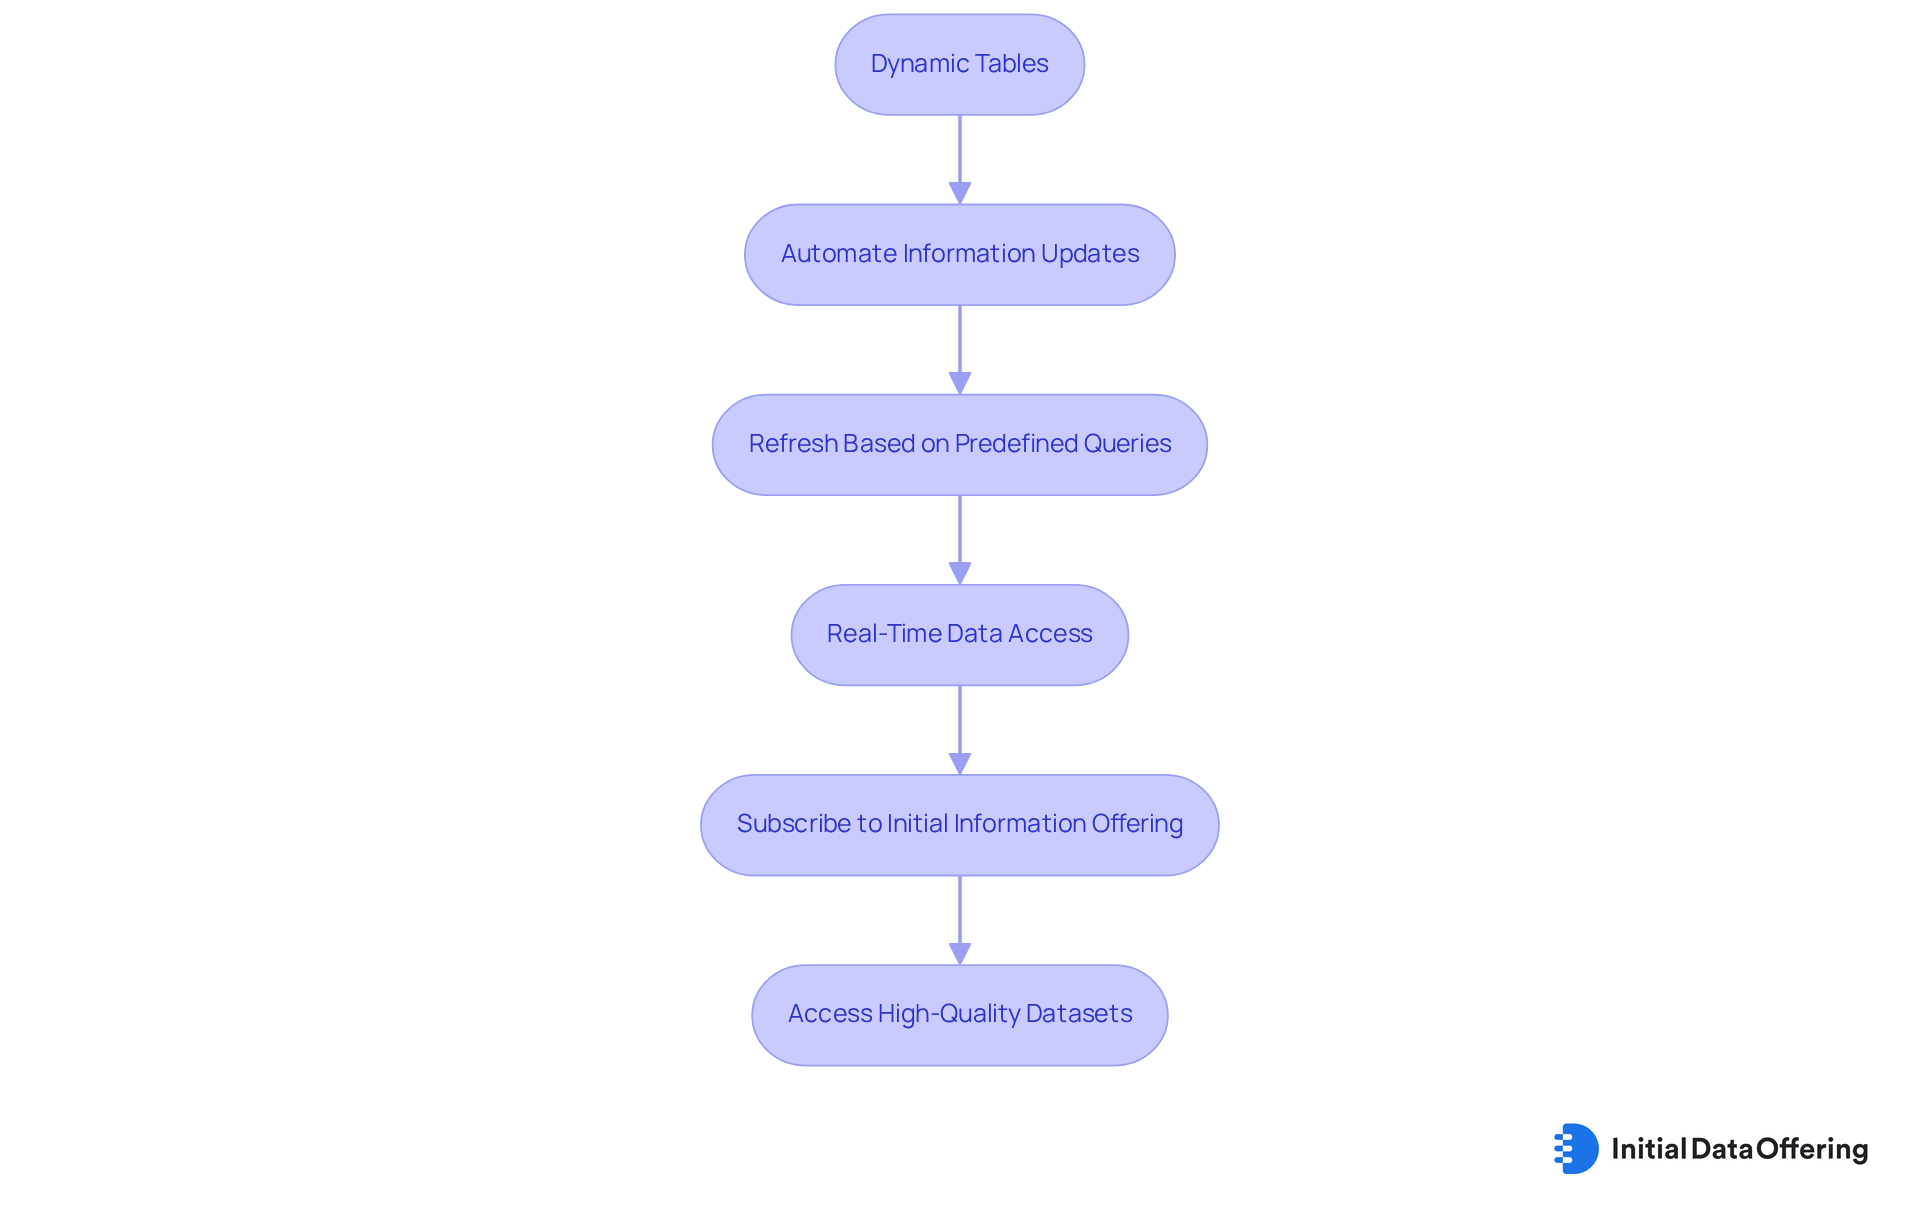
Automation: Ensure Real-Time Data Updates with Dynamic Tables
A prominent characteristic of a dynamic table is its capability to automate information updates. These dynamic tables refresh automatically based on predefined queries, ensuring that users always have access to the latest information, including new datasets listed daily on the Initial Data Offering platform. This automation significantly decreases the likelihood of mistakes linked to manual updates, enabling organizations to respond swiftly to evolving information conditions. For businesses relying on real-time analytics, this capability is indispensable.
By subscribing to Initial Information Offering, market research analysts can uncover high-quality datasets daily, which enhances their analysis capabilities. How can these datasets transform your insights? With premium access to unique collections, analysts are equipped to elevate their research and decision-making processes. Subscribe now to gain access to invaluable resources that can truly make a difference in your work.
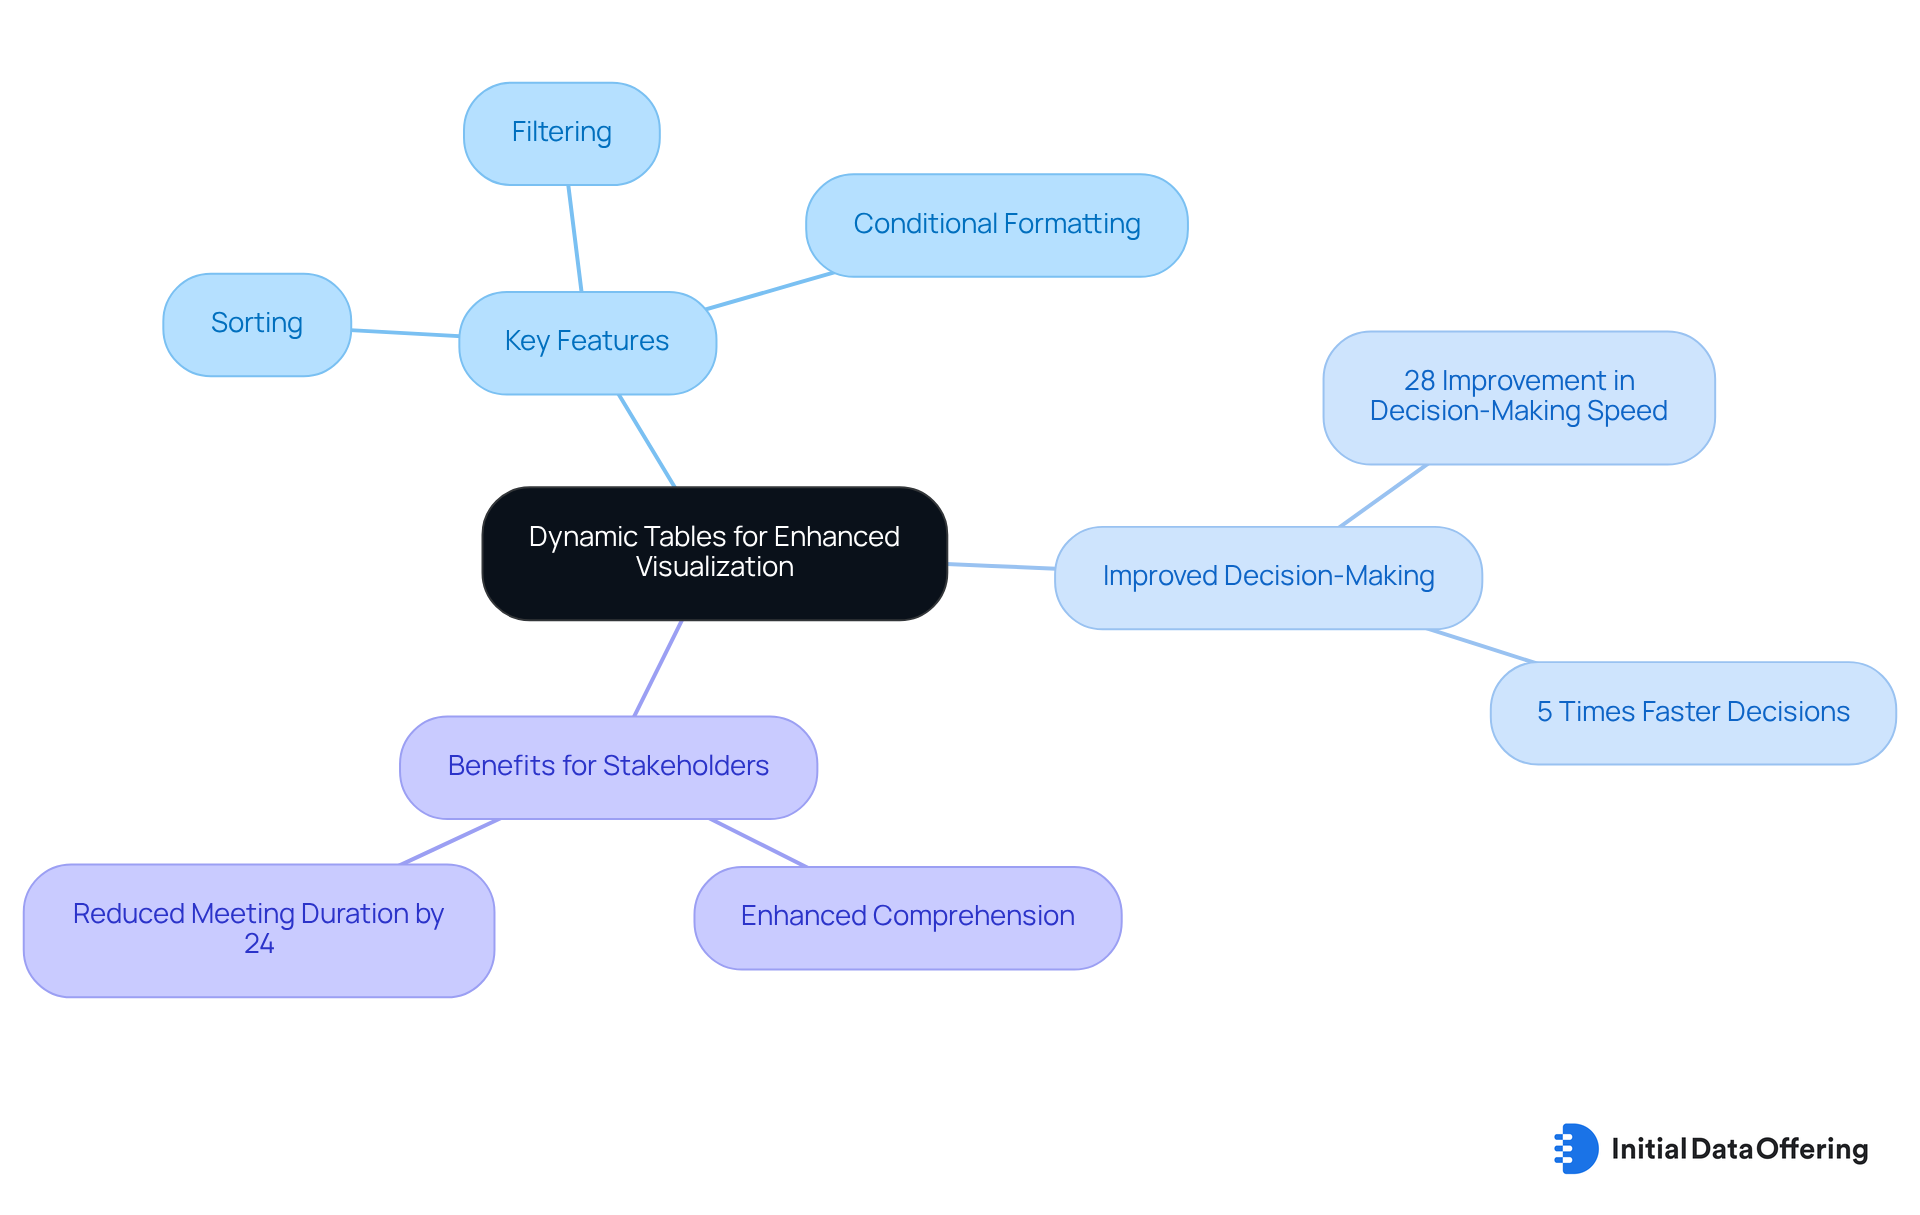
Enhanced Visualization: Simplify Complex Data with Dynamic Tables
Dynamic tables significantly enhance information visualization by transforming intricate datasets into formats that are easily understandable. Users can utilize built-in features such as sorting, filtering, and conditional formatting to highlight key trends and insights. This simplification is particularly vital for stakeholders without a technical background, enabling them to quickly grasp the implications of the information.
For instance, organizations that have adopted flexible structures report a 28% improvement in decision-making speed, showcasing their effectiveness in fostering better communication and comprehension of essential information. Furthermore, firms that employ visual representation are five times more likely to make quicker decisions, underscoring the impact of interactive charts on decision-making processes.
As industry specialists like Raja Antony emphasize, the ability to present information clearly and systematically is crucial for facilitating informed choices, especially in environments that require rapid understanding. Additionally, visualization tools can reduce the duration of business meetings by 24%, further demonstrating the effectiveness achieved through the use of a dynamic table.
By leveraging these tools, businesses can ensure that all stakeholders, regardless of their technical expertise, can engage with and utilize information effectively.
Collaboration: Foster Teamwork with Shareable Dynamic Tables
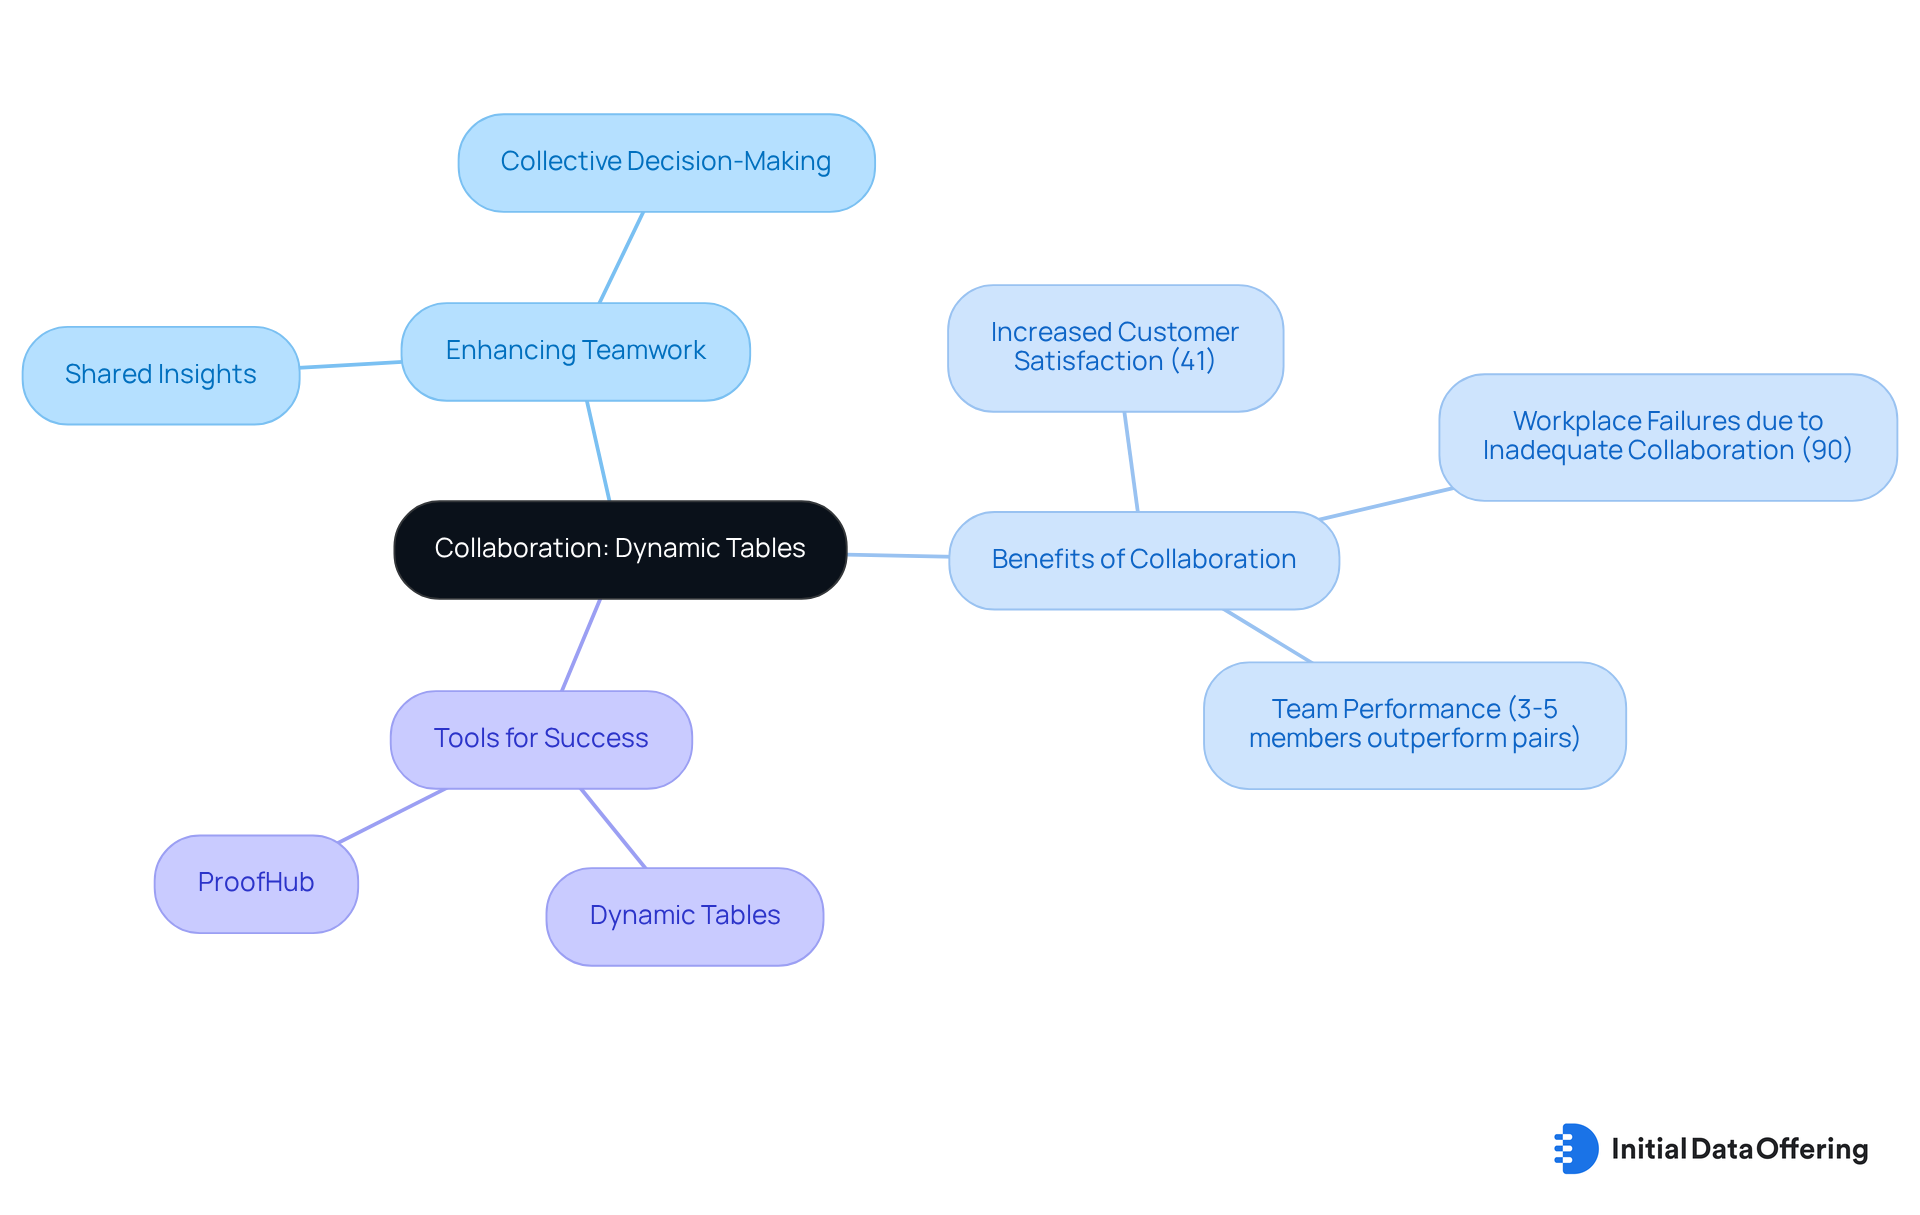
Dynamic tables act as a powerful tool for enhancing collaboration within teams. By facilitating the easy sharing of customized views and analyses, they ensure that all stakeholders can access the same information insights. This is crucial for fostering teamwork and collective decision-making. Research indicates that effective collaboration can lead to a 41% increase in customer satisfaction, as noted in a study by Alludo, and significantly improve overall performance. Furthermore, 90% of participants link workplace failures to inadequate collaboration, highlighting the essential need for efficient teamwork in analysis.
The advantages of using flexible charts are clear. They enable entities to leverage varied viewpoints and knowledge, ultimately leading to more informed and strategic outcomes. For instance, teams of three to five people have been shown to outperform pairs and individuals in solving complex problems, according to research from the American Psychological Association. This underscores the value of collaborative efforts in data-driven environments. As companies increasingly emphasize collaboration, how can your team harness the capacity to share information insights through interactive charts?
In conclusion, the ability to share insights through a dynamic table is crucial for fostering innovation and achieving common objectives. By facilitating cooperative information examination, these tools not only enhance teamwork but also drive better decision-making processes. As you consider the implications for your organization, think about how implementing such collaborative tools could transform your team's performance and overall success.
Integration: Connect Dynamic Tables with Multiple Data Sources
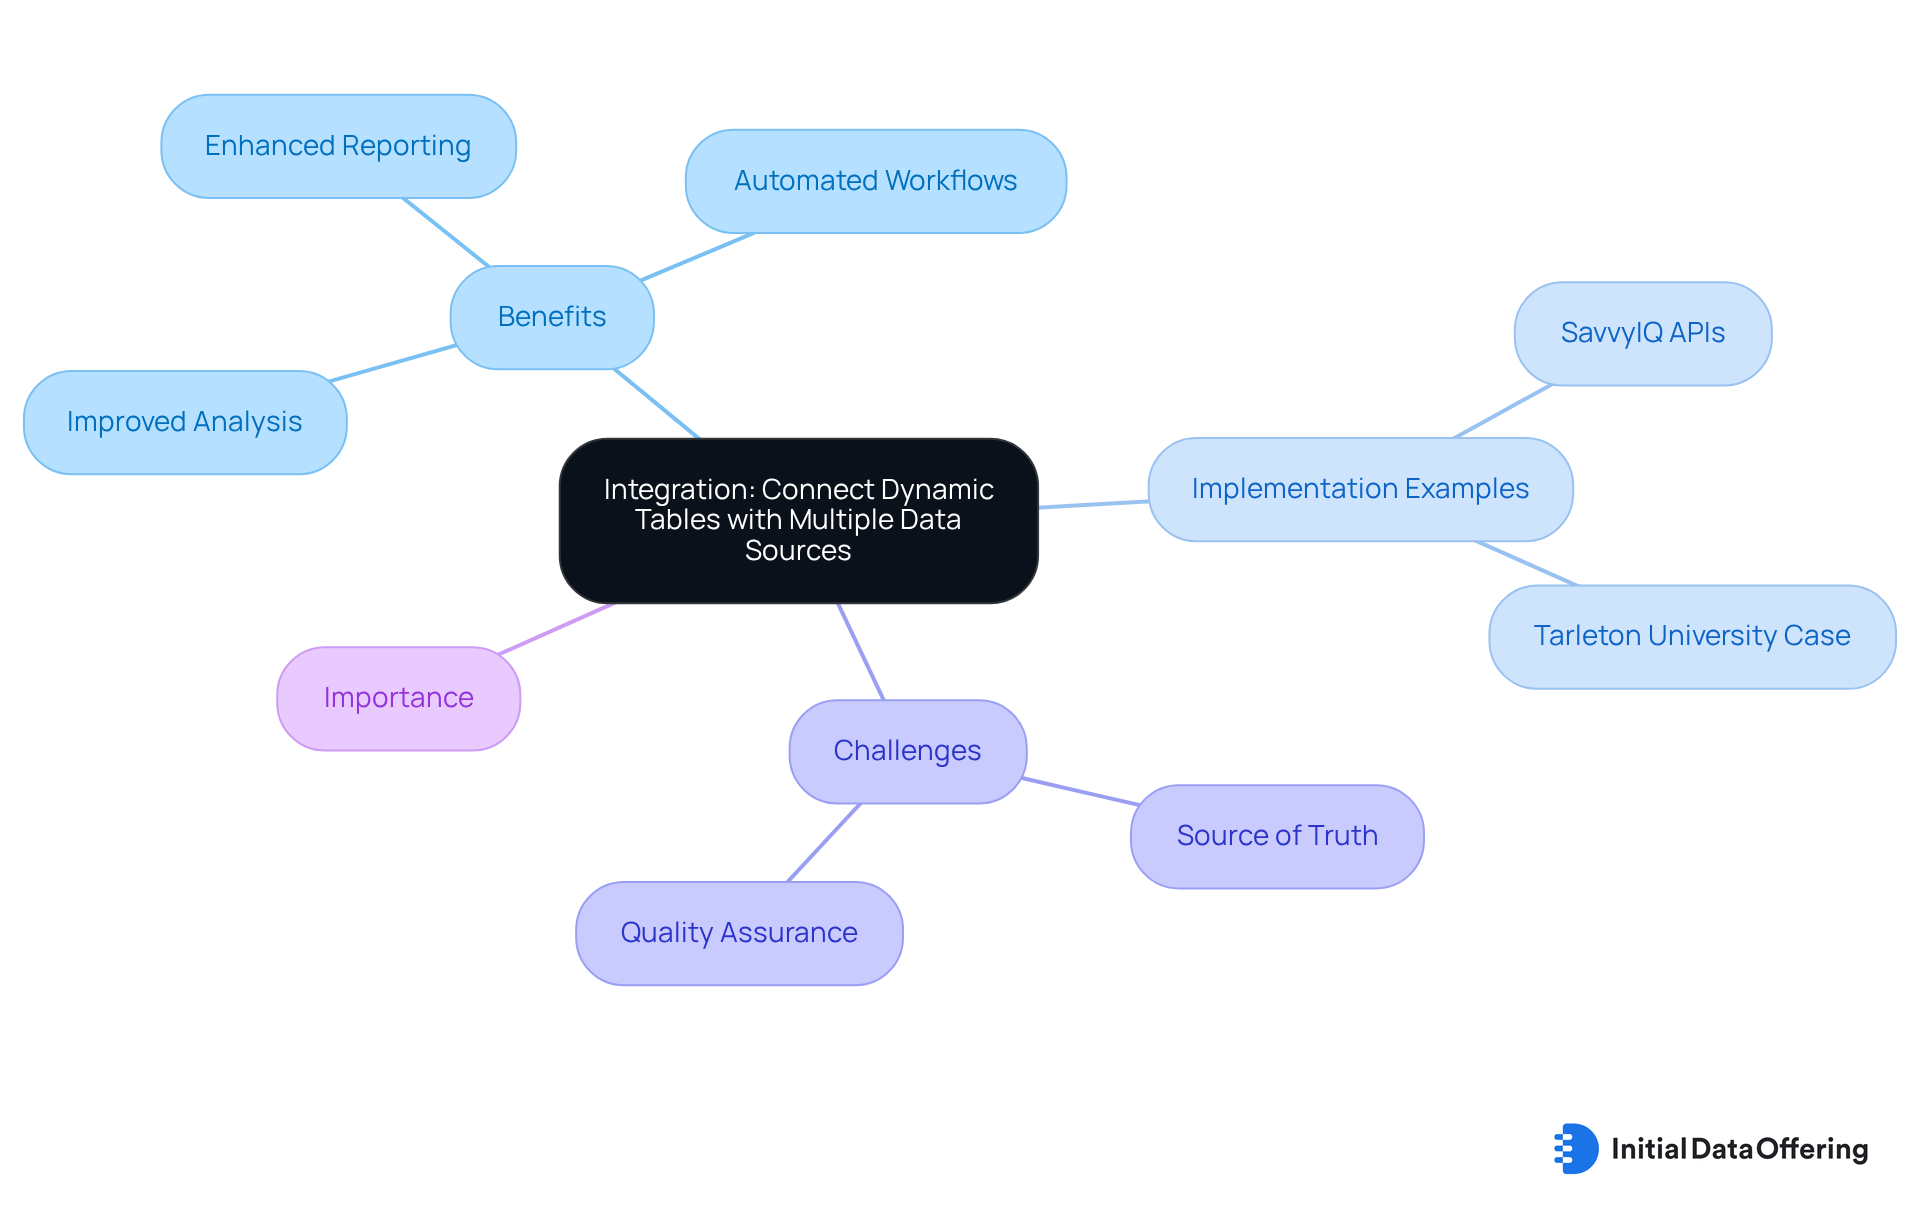
Dynamic structures offer robust integration features with various information sources, enabling users to effortlessly combine content from multiple platforms and databases. This functionality is vital for organizations that rely on diverse datasets for comprehensive analysis. By linking dynamic tables to various information sources, users can create a comprehensive view of their landscape, facilitating more informed decision-making and strategic planning.
SavvyIQ, as part of the Initial Information Offering, provides AI-powered APIs that enhance this process by improving information quality and accessibility. This allows businesses to automate workflows and eliminate manual information tasks. For instance, Tarleton University successfully established a cloud-based information warehousing solution that improved reporting capabilities and streamlined access to related information. This advancement enabled better trend analysis and forecasting.
Experts in information integration emphasize that while flexible structures enhance information visibility, it is crucial to ensure quality assurance before releasing information sources to maintain reliability. Furthermore, connecting dynamic tables to various platforms enriches the analytical process, allowing businesses to effectively leverage insights from multiple sources. However, organizations must also navigate challenges, such as identifying the source of truth when multiple systems capture the same information.
As the demand for thorough information analysis continues to rise, the importance of multi-source information integration becomes increasingly evident. This positions organizations to thrive in a competitive landscape, underscoring the necessity of embracing these advanced integration capabilities.
Accessibility: Use Dynamic Tables Across Platforms and Devices
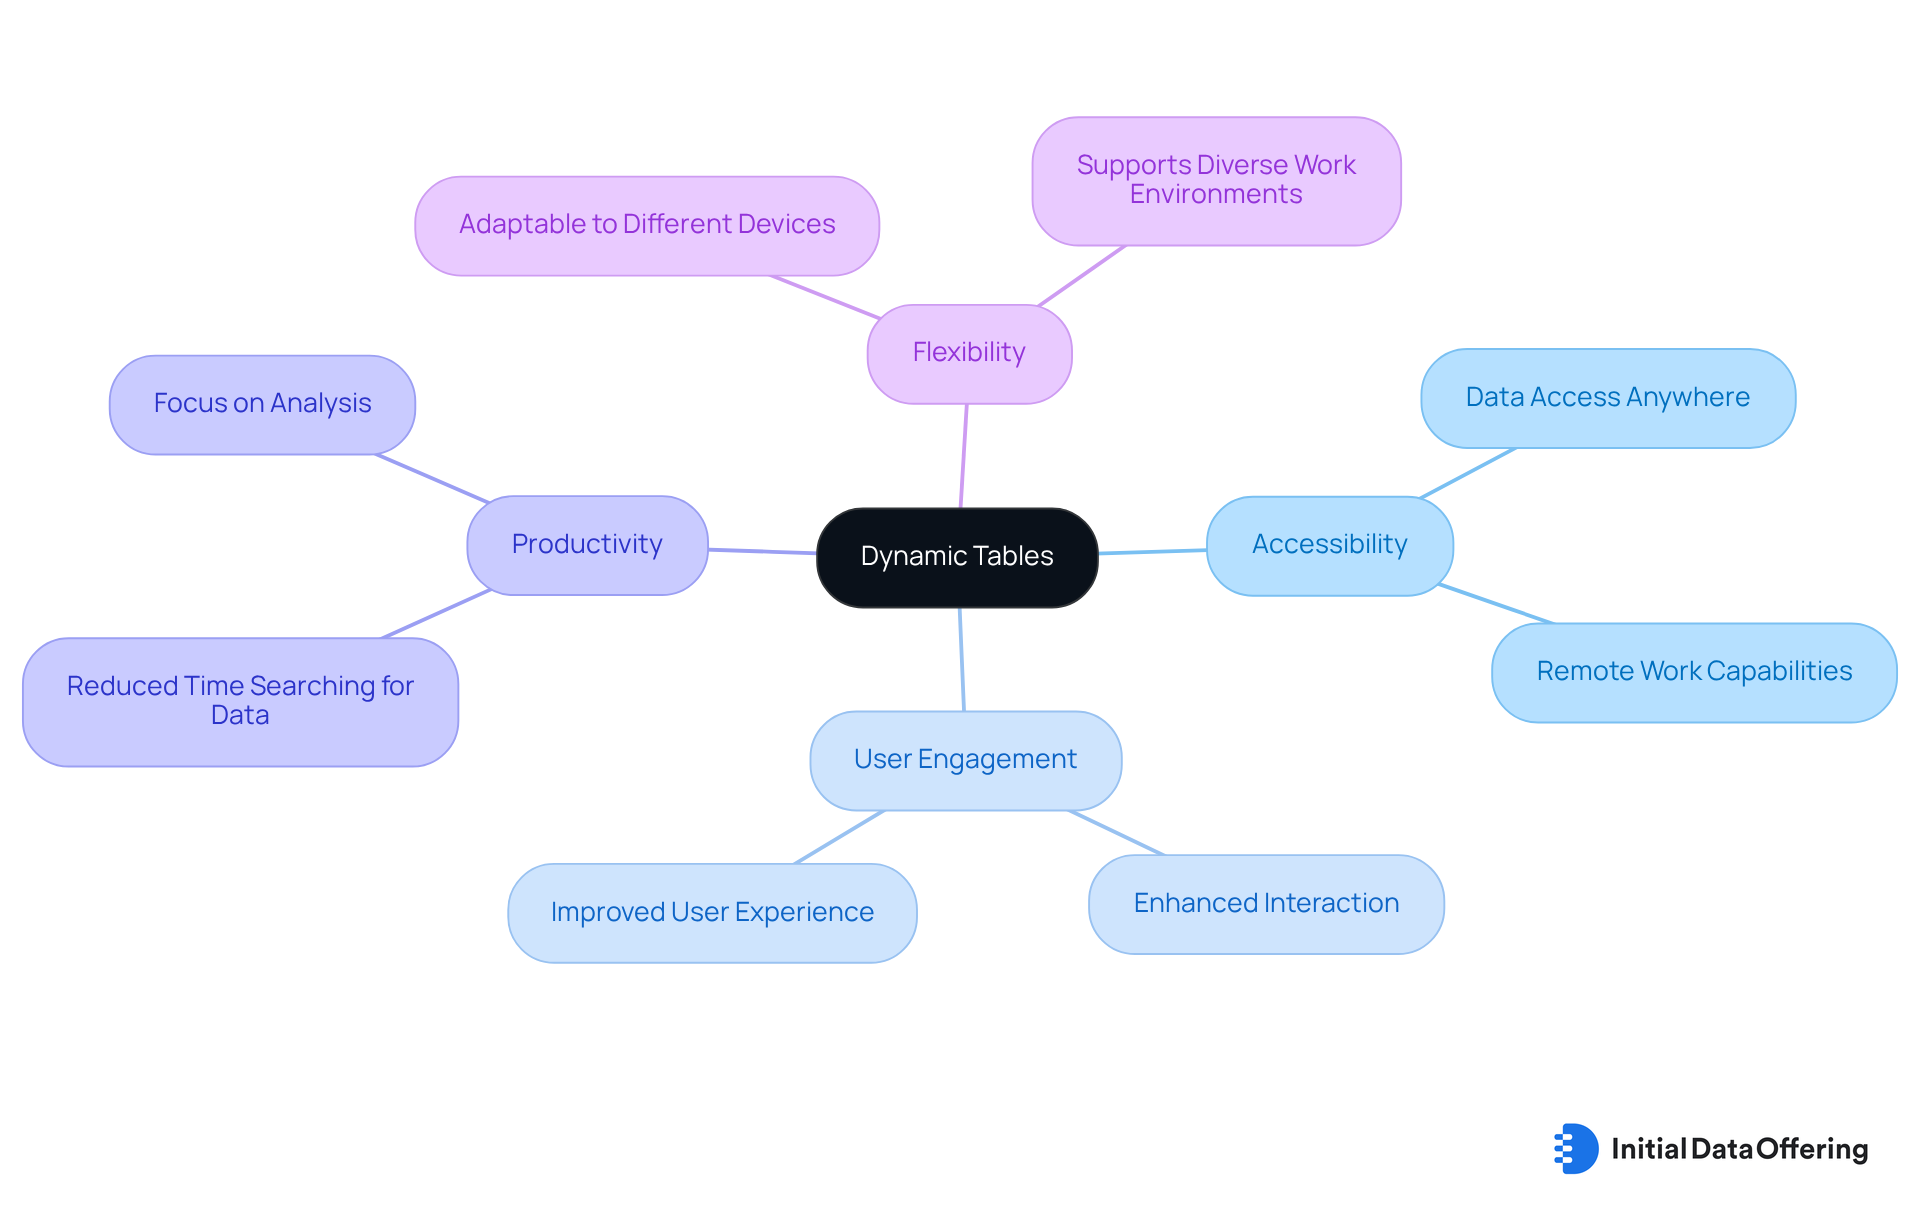
Dynamic tables are created with accessibility in mind, allowing users to interact with them seamlessly across different platforms and devices. Whether on a desktop, tablet, or mobile device, users can access and analyze data without limitations. This dynamic table serves as a crucial advantage for modern organizations that prioritize flexibility and remote work capabilities. By ensuring that the dynamic table is accessible from anywhere, IDO not only enhances user engagement but also boosts productivity.
How might your organization benefit from such accessibility? Consider the implications of having data at your fingertips, regardless of location.
Cost-Effectiveness: Reduce Tool Overhead with Dynamic Tables
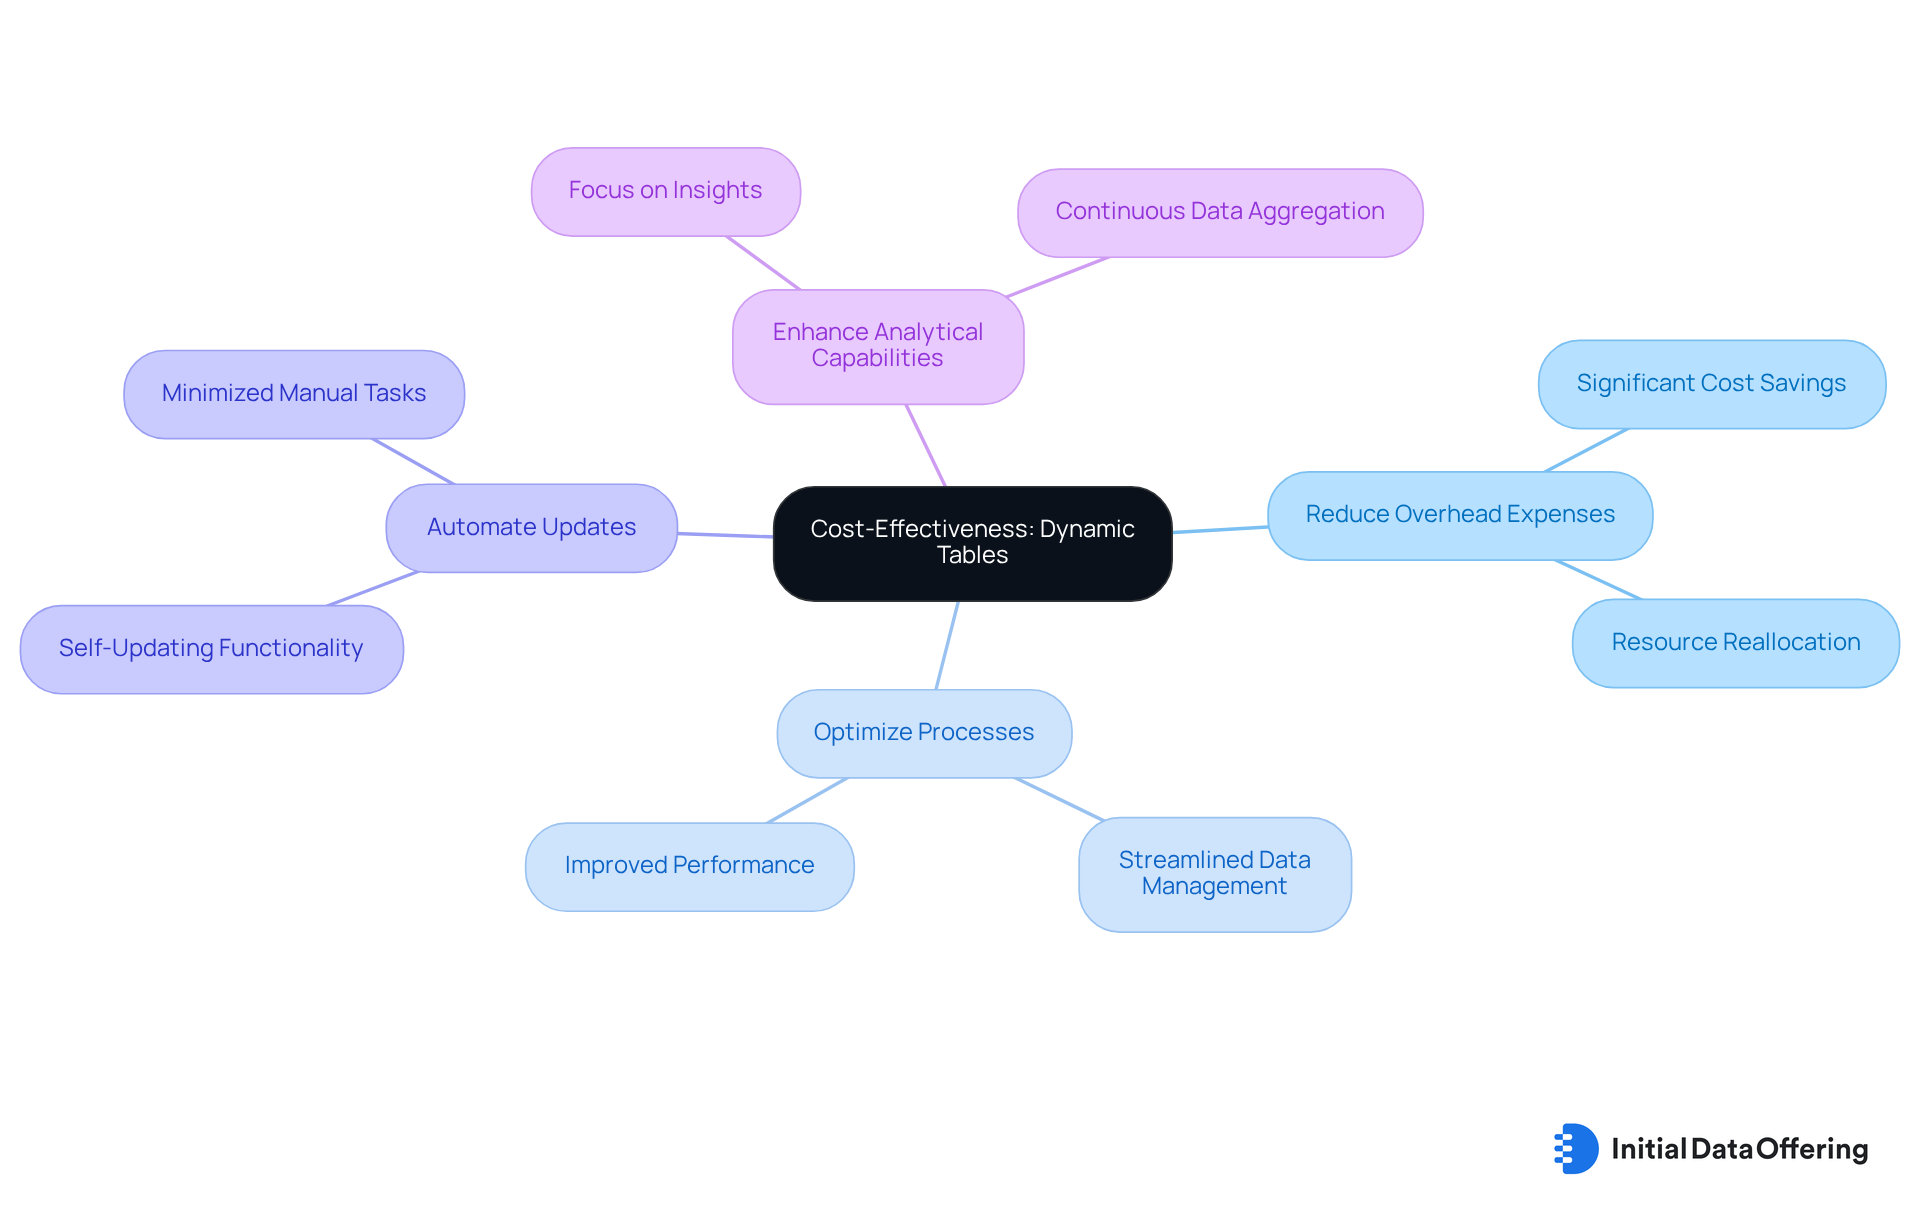
Dynamic tables serve as an effective resource for reducing overhead expenses in analysis by optimizing processes and diminishing reliance on various tools. These structures, known as dynamic tables, automate incremental updates and simplify analysis, eliminating the need for manual information management, which can be both time-consuming and error-prone. Organizations that adopt flexible structures, such as a dynamic table, report significant efficiencies, as these frameworks improve performance and facilitate continuous information aggregation from diverse sources. This efficiency not only reduces operational costs but also enables companies to redirect resources towards more strategic initiatives.
Financial analysts underscore the importance of this approach, noting that a dynamic table can transform information processes into a more integrated and cost-effective system. As one analyst pointed out, 'Dynamic tables function like self-updating spreadsheets, allowing entities to focus on insights instead of the intricacies of information management.' This shift in focus is crucial for maximizing return on investment in analytics.
Looking ahead to 2025, the trend of reducing analysis expenses through adaptable charts continues to gain traction, with numerous organizations embracing this technology to enhance their analytical capabilities while managing costs. By adopting flexible structures, companies not only improve their information processes but also establish a dynamic table that positions them for greater success in an increasingly insight-driven environment.
Scalability: Adapt Dynamic Tables to Growing Data Needs
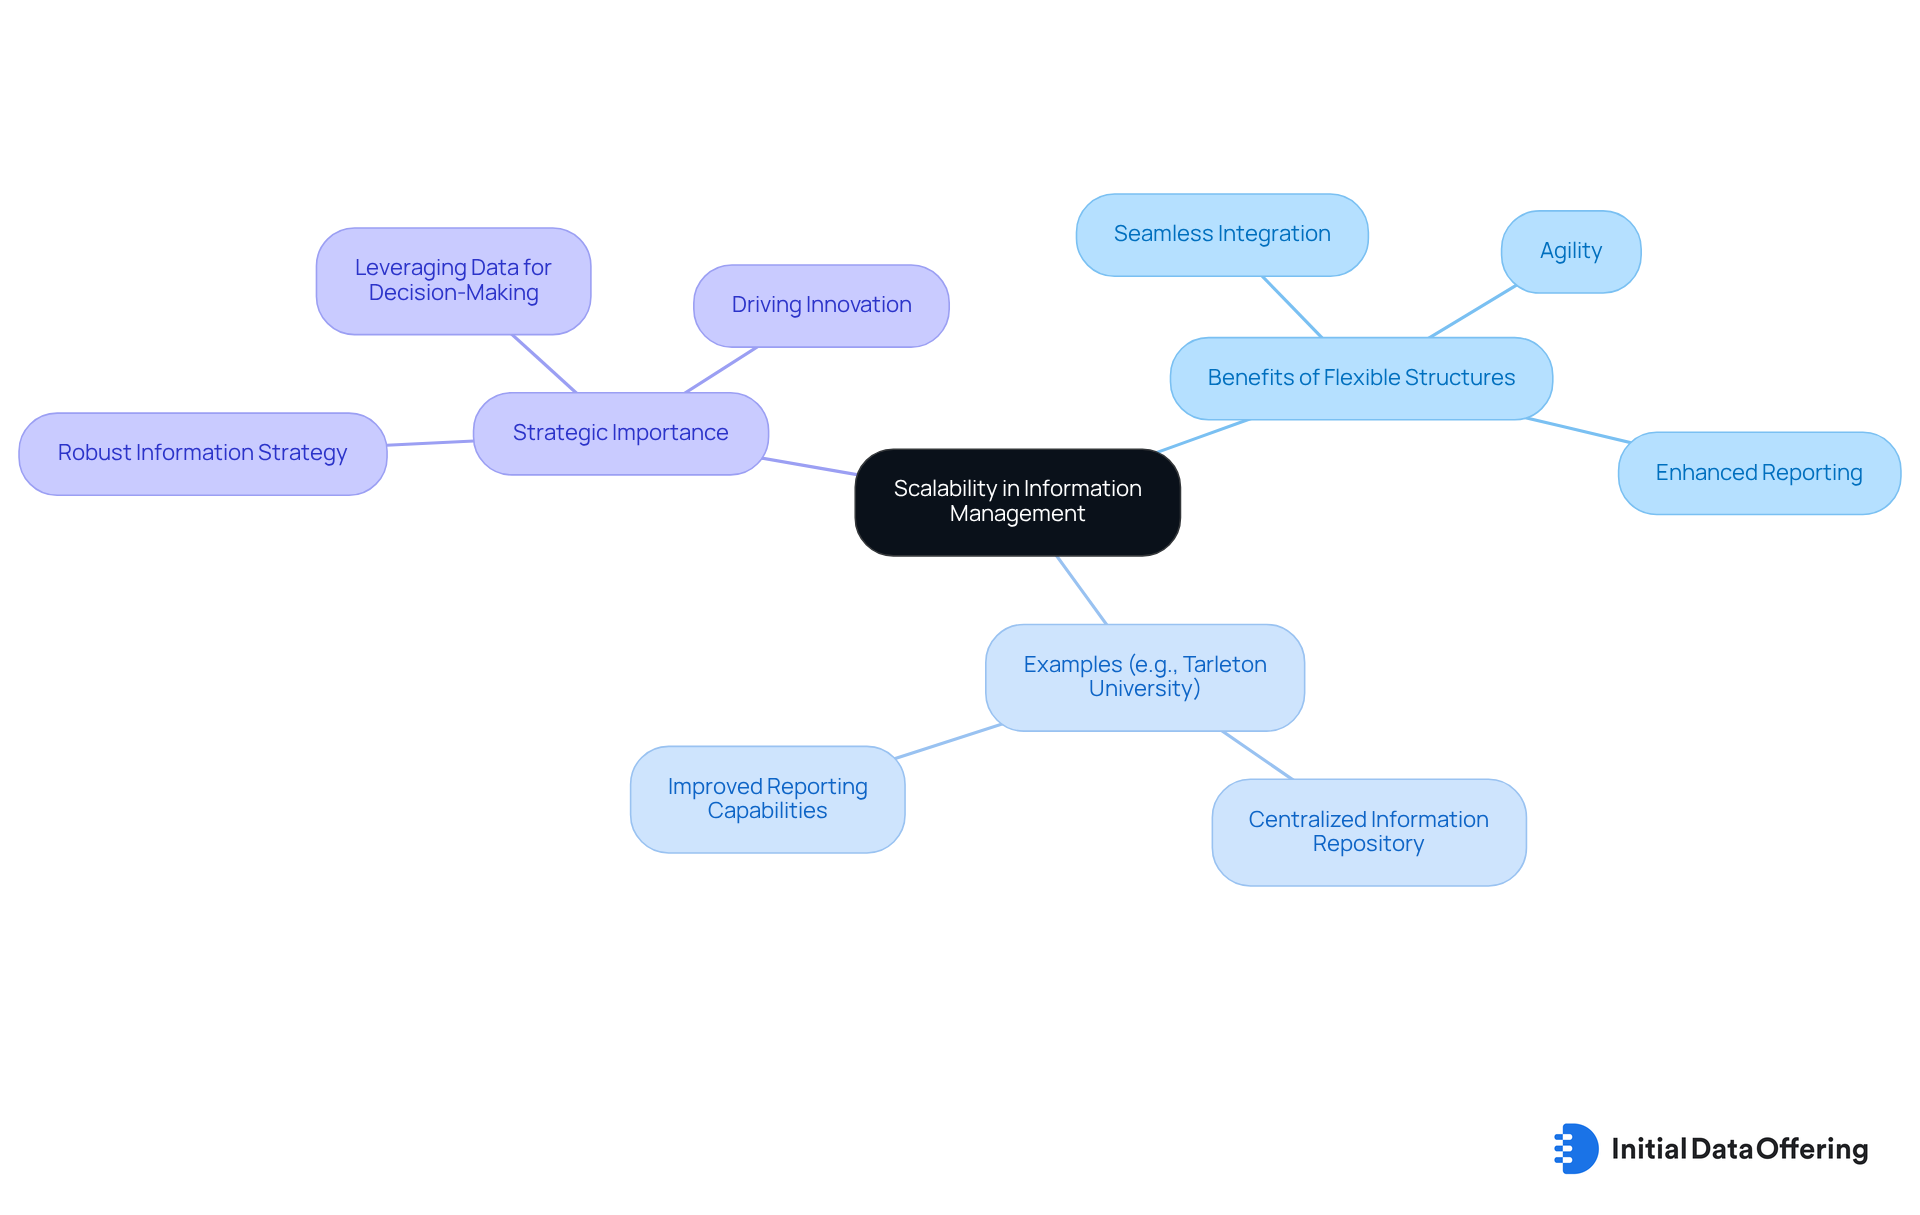
Flexible structures offer remarkable scalability, enabling entities to adapt to increasing information demands without extensive reconfiguration. As the volume of information rises, these structures can seamlessly integrate additional sources and manage larger datasets. This inherent adaptability ensures that organizations can effectively leverage their information, regardless of a shifting landscape.
For instance, institutions like Tarleton University have successfully created centralized information repositories that enhance reporting capabilities and streamline access to vital data, illustrating the practical benefits of flexible structures in managing expanding information volumes.
Information architecture experts emphasize that a robust information strategy is essential for responding to these growing demands. Organizations that prioritize quality and strategic use of information are more likely to thrive in today’s data-driven environment.
By embracing scalable solutions like a dynamic table, companies can maintain agility and responsiveness in their information management practices, ultimately promoting better decision-making and fostering innovation.
Insight Generation: Drive Better Decisions with Dynamic Tables
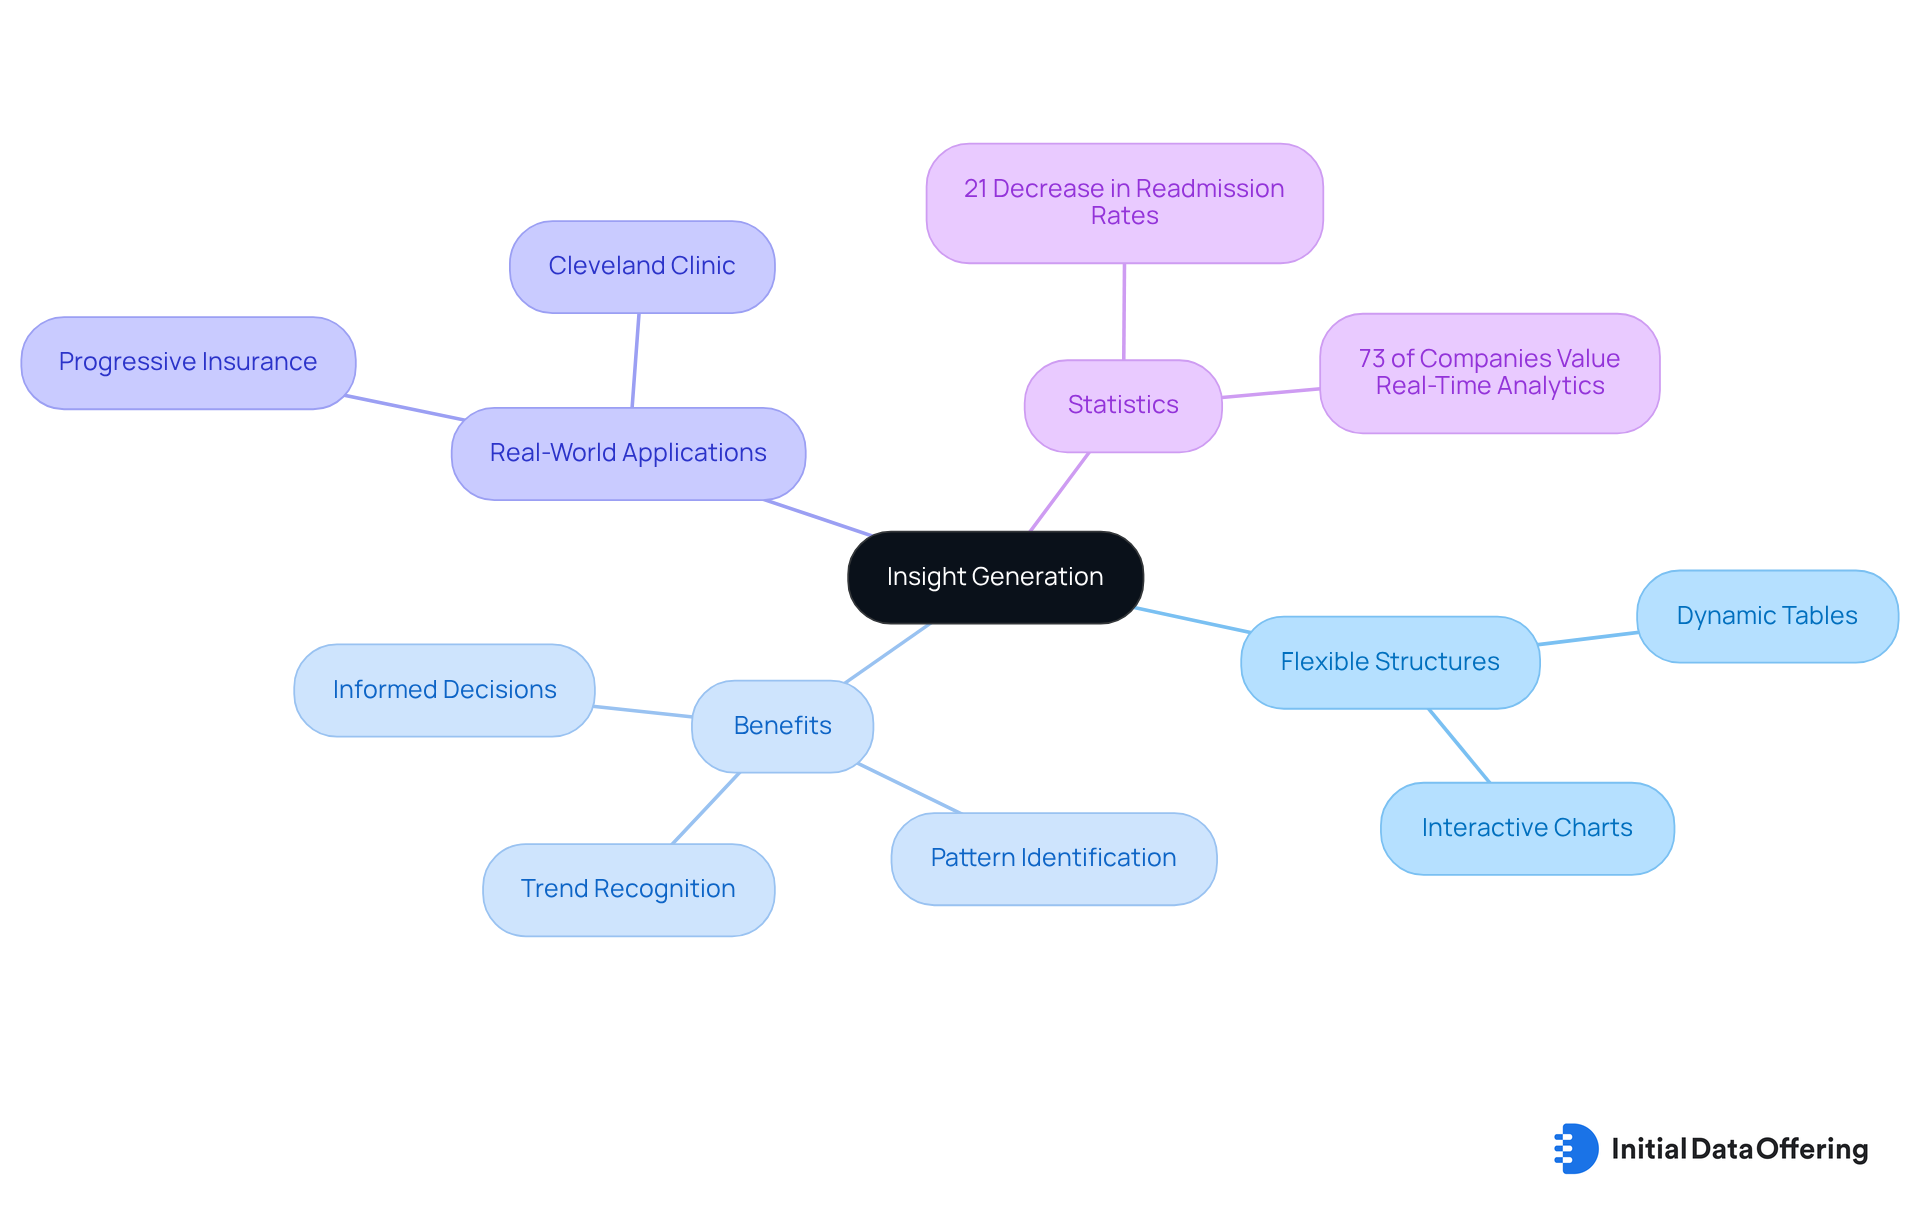
Flexible structures enable entities to produce insights effectively, equipping users with essential tools to examine information and derive practical conclusions. These charts simplify data exploration and visualization, assisting in recognizing trends, patterns, and anomalies crucial for informed strategic decisions. The ability to generate insights swiftly and accurately is vital for businesses striving to maintain a competitive advantage in their markets.
For instance, companies like Progressive Insurance utilize flexible charts to enhance their data-informed decision-making processes, allowing them to customize insurance rates based on actual driving behavior rather than demographic assumptions. Similarly, Cleveland Clinic's use of predictive analytics through interactive charts has led to a 21% decrease in patient readmission rates by identifying high-risk individuals for preventive measures.
Moreover, 73% of companies recognize real-time analytics as essential for sustaining a competitive advantage, underscoring the importance of flexible data structures in this context. As the volume of information continues to grow, the ability to leverage flexible structures will become increasingly critical for entities aiming to navigate complexities and achieve better outcomes.
Business analysts emphasize that these charts not only streamline information management but also enhance the overall decision-making framework, making them indispensable in today’s information-driven environment. Additionally, the dynamic table's automated updates and incremental refresh capabilities ensure that organizations can depend on the most current data for their analyses, further solidifying their role in effective decision-making.
Conclusion
Dynamic tables represent a transformative approach to data analysis, offering organizations the flexibility and efficiency necessary to thrive in today’s information-rich environment. By leveraging these innovative structures, businesses can streamline their data processes, enhance collaboration, and ultimately drive better decision-making. The integration of dynamic tables into analytical frameworks not only optimizes workflows but also ensures that users have immediate access to the most relevant insights, fostering a more informed and agile decision-making culture.
The numerous benefits of dynamic tables are evident. Their ability to automate real-time updates and enhance data visualization, along with their scalability and cost-effectiveness, empowers users to customize their data presentations. This customization leads to improved productivity and collaboration. Case studies and statistics illustrate how organizations can leverage dynamic tables to manage extensive datasets, simplify complex information, and derive actionable insights that align with strategic objectives.
In a world where data-driven decision-making is paramount, embracing the capabilities of dynamic tables is essential for any organization seeking to maintain a competitive edge. By adopting these flexible structures, teams can enhance their analytical processes and cultivate a culture of innovation and collaboration. Organizations are encouraged to explore the integration of dynamic tables into their workflows to unlock the full potential of their data, ensuring they are well-equipped to navigate the complexities of the modern business landscape.
Frequently Asked Questions
What is an Initial Data Offering (IDO)?
An Initial Data Offering (IDO) leverages flexible structures to improve information analysis procedures, providing users with immediate access to the latest information through automatic updates based on preset queries.
How do dynamic tables enhance productivity?
Dynamic tables optimize information operations, allowing users to focus on deriving insights rather than managing information infrastructure, which helps mitigate the considerable productivity losses professionals face when searching for information.
What are the practical applications of flexible structures in data analysis?
Flexible structures enhance analysis efficiency by enabling real-time analytics, allowing organizations to respond swiftly to market changes, such as a global retail company that used flexible charts for calculating quarter-to-date order totals.
How does AI integration enhance dynamic tables?
AI-driven solutions, like those from SavvyIQ, enrich and expand datasets through the Recursive Data Engine, facilitating dynamic updates of information and ensuring access to the most relevant and high-quality datasets.
Why is real-time information access important?
Real-time information access is crucial for transforming large volumes of data into actionable insights, as timely information is essential for informed business decision-making.
How do dynamic tables allow for customization?
Dynamic tables enable users to customize their views by selecting specific columns, applying filters, and adjusting layouts to meet their analytical needs, particularly useful for market research analysts.
What benefits do analysts gain from using dynamic tables?
Analysts can focus on the most relevant details, enhancing their analysis and decision-making regarding complex datasets, such as equity crowding and fund positions.
What is the significance of automation in dynamic tables?
Automation in dynamic tables ensures real-time data updates based on predefined queries, reducing the likelihood of manual errors and enabling organizations to respond quickly to changing information conditions.
How can subscribing to the Initial Data Offering benefit market research analysts?
By subscribing, analysts can access high-quality datasets daily, enhancing their research capabilities and elevating their decision-making processes.